


0
Currency & Commodity Analysis:
US Dollar Index
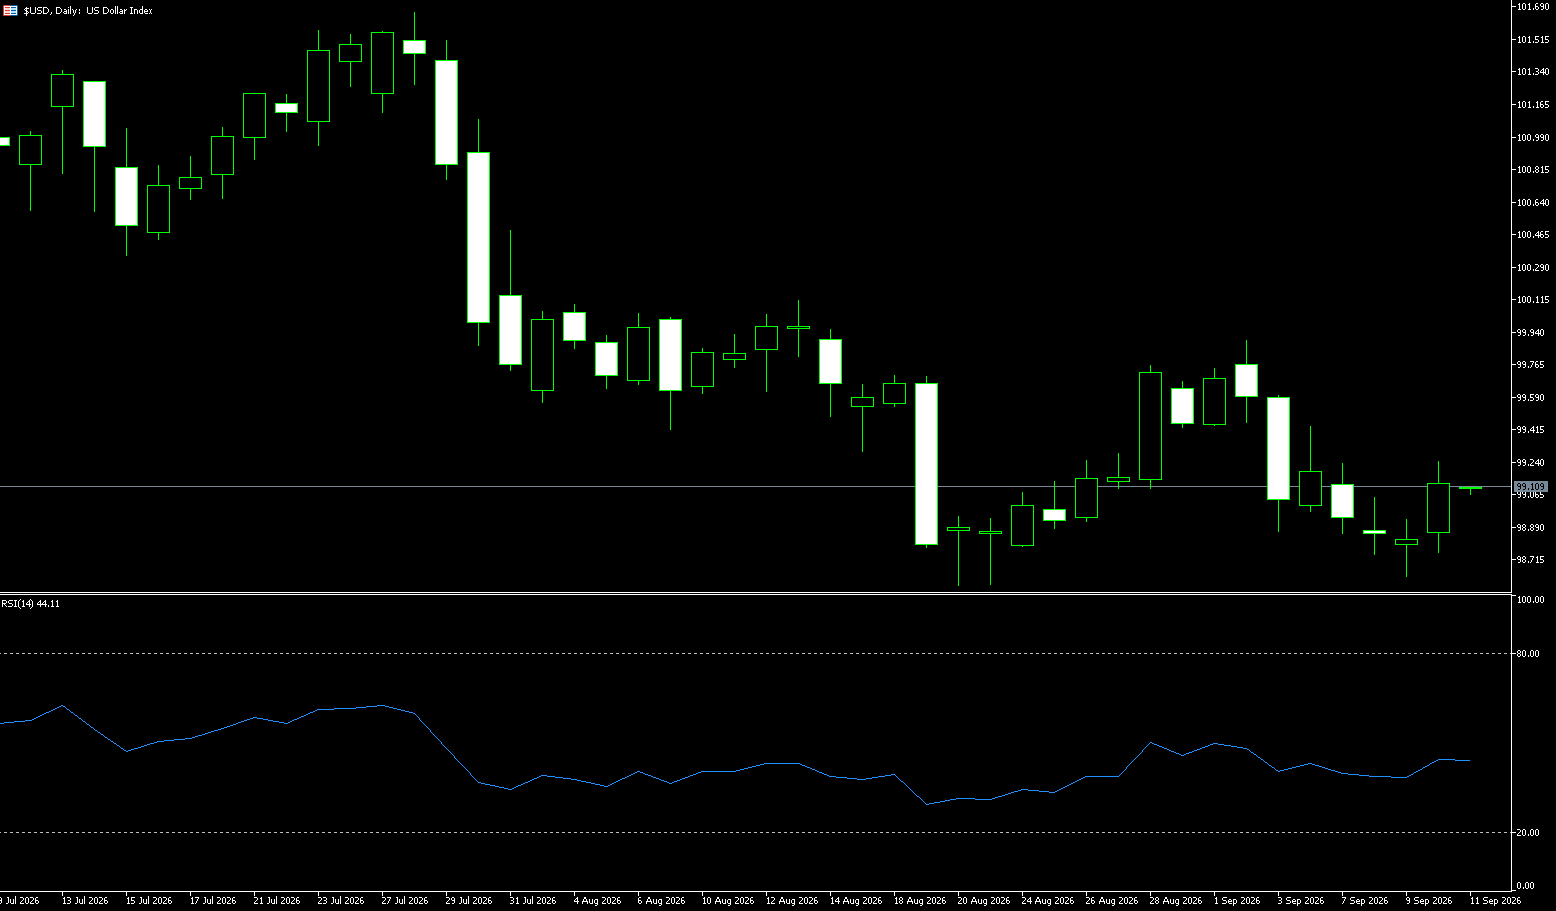
The US Dollar Index held above the 101 level heading into the weekend, marking four consecutive days of gains and reaching a near two-month high; it is on track for a second straight week of increases. The dollar's strength—driven by high oil prices and robust US economic data—has stoked inflation concerns and reinforced market expectations that the Federal Reserve may tighten policy further. Markets currently price in a roughly 67% probability of a Fed rate hike in October, following the hike implemented last week. New York Fed President John Williams stated that the central bank still has significant work to do to tame inflation, while Philadelphia Fed President Anna Paulson noted that modest additional policy tightening might be necessary. Regarding economic data, initial jobless claims unexpectedly fell by 1,000 to 197,000—a two-month low—demonstrating labor market resilience. Investors are now awaiting Friday's data on consumer confidence and durable goods orders for further clues regarding the economy's trajectory. Last week, the US Dollar Index remained above the 101.00 level for the majority of the time, briefly climbing to around 101.40—a fresh high in approximately eight weeks. The dollar strengthened broadly against major currencies; notably, it rose by about 1.17% against the Australian dollar, 1.13% against the British pound, and 0.91% against the euro, indicating that the dollar's recent strength is underpinned by broad market support. Key drivers included improving US economic data and a resurgence in inflation expectations. The preliminary US S&P Global Composite PMI for September rose to 58.4, significantly higher than August's 56.0, while the Manufacturing PMI climbed to 57.0, well above the previous 53.9. Although the pace of growth in the services sector slowed slightly, overall business activity remained robust, signaling continued strong momentum in the US economy during the third quarter. A rebound in oil prices also provided policy-related support for the dollar; the inflationary pressure associated with rising oil prices tends to draw market attention and reinforces expectations that the Federal Reserve will maintain higher interest rates for longer.
Last week, the US Dollar Index posted gains for four consecutive days, fluctuated at high levels on Friday, and closed the week with a bullish candle—marking its second straight week of gains. The price established itself above the 101 mark, hitting a near three-month high. This movement was primarily driven by strong US employment data and hawkish remarks from Federal Reserve officials, which led the market to raise the probability of an October rate hike; rising US Treasury yields further fueled buying interest in the dollar. With lows consistently moving higher, the index is tracing a classic upward channel. The price has stabilized above the 20-day and 50-day moving averages, which are aligned in a bullish formation. The RSI has climbed toward 70, entering a high, slightly overbought zone; short-term upward momentum shows signs of exhaustion, raising the possibility of a pullback due to profit-taking. While the MACD histogram remains positive (red bars), the rate of expansion has slowed, and the risk of a bearish divergence is gradually accumulating. Market summary: The trend is bullish, but the asset is overbought in the short term; high-level volatility has intensified, and divergence between bulls and bears has widened. Positive fundamentals have already been partially priced in; chasing long positions now offers a less favorable risk-reward ratio, while the risks of high-level volatility and rapid pullbacks are rising.
If oil prices continue to strengthen and drive up inflation expectations again, the US dollar may receive additional support; conversely, if oil prices retreat significantly alongside cooling US economic data, the pressure for a pullback from current highs could increase. The daily chart structure of the US Dollar Index remains distinctly bullish, with the price currently trading above the 20-day EMA (located around 99.98), which has shifted from a resistance level to a key trend support level. As long as the index holds above this moving average, the overall short-term bullish structure remains intact. Immediate upside focus is on the recent high near 101.40; a decisive break above this could open the way to 101.80 (June 24 high) and the 102.00 (psychological round number) area. However, the RSI (14) is above 70—indicating overbought conditions and a concentrated short-term rally—which raises the risk of subsequent consolidation or a technical pullback. If the rally stalls and the price falls below the 100.89 level (5-day EMA), attention should shift to the 100.00 psychological mark and the 20-day EMA support near 99.98. A daily close below 99.98 could signal a shift from the current bullish structure into a deeper correction.
Consider shorting the US Dollar Index at 101.12 today; Stop Loss: 101.25; Targets: 100.80, 100.70.
WTI Spot Crude Oil
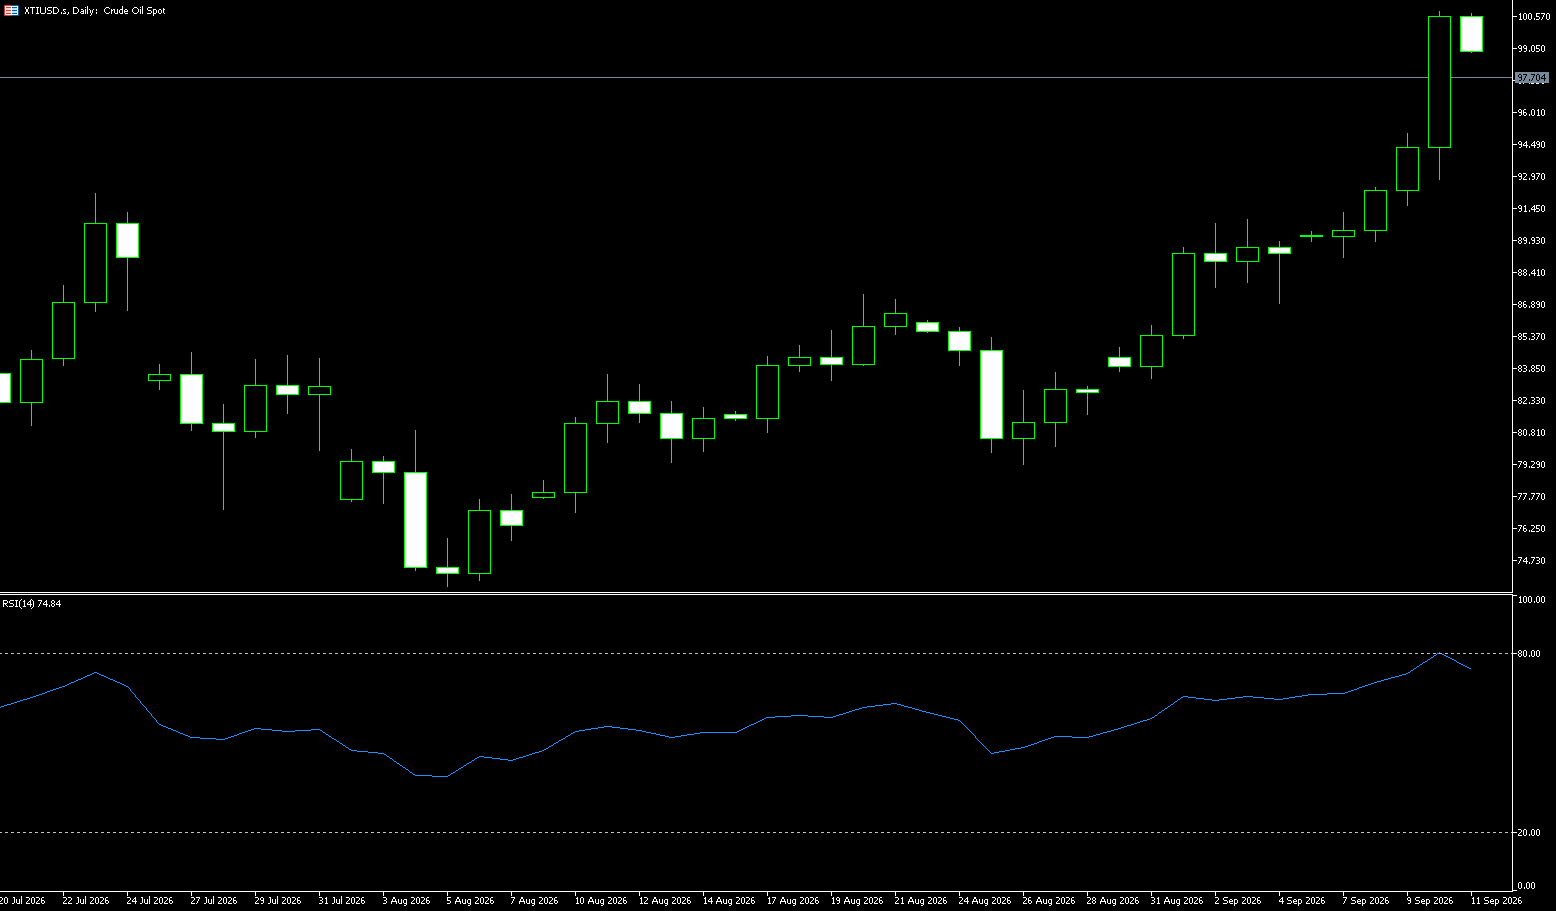
WTI crude oil prices held above $91 per barrel this week, halting an earlier rally ahead of the weekend following reports that the U.S. and Iran are considering a phased agreement that could reopen the Strait of Hormuz and lift the U.S. blockade on Iranian ports. Qatari officials are reportedly mediating talks during the UN General Assembly in hopes of achieving a breakthrough. Iran insists on maintaining control over the Strait of Hormuz and refuses to accept any deal unless the U.S. eases military pressure and lifts the blockade. Meanwhile, White House officials stated that President Trump remains open to negotiations with Iran but emphasized that the U.S. faces little pressure to negotiate, given its strong position following sanctions and the blockade. Elsewhere, tensions in the Middle East have escalated as Iranian-backed Houthi rebels fired missiles at Saudi cities—including Yanbu and Taif—in Yemen. Despite recent gains, the U.S. crude benchmark is still expected to fall by approximately 2% for the week.
The primary reason for the pullback in oil prices ahead of the weekend was news of progress in U.S.-Iran negotiations. Negotiators from both nations are exploring a phased path to end the conflict in New York; this could involve reopening the Strait of Hormuz and Washington lifting its economic blockade on Iranian ports. These talks, mediated by Qatari officials, are taking place alongside the UN General Assembly. However, significant obstacles remain. Iran insists on retaining control of the Strait of Hormuz and rejects any agreement unless the U.S. reduces military pressure and lifts the port blockade. White House officials have indicated that President Trump is open to discussions but emphasized that the U.S. faces little pressure to negotiate, given its strong position following the imposition of sanctions. Last week, WTI crude oil retreated from its highs. After initially surging to test overhead resistance, the price faced pressure from expectations of easing geopolitical tensions, causing the risk premium to contract and leading to a period of high-level volatility and correction. Prices ranged from a high near $96 to a low around the $88 mark. The weekly candlestick closed as a bearish candle with a long upper shadow, indicating a pullback following the prior rally; however, the broader bullish structure remains intact. Key technical conclusion: Long positions at high levels were liquidated for profit, and geopolitical news drove a pullback in the risk premium; while the short-term daily outlook has weakened, the medium-term upward structure remains sound. The critical threshold is the $90 mark: holding above $90 implies a corrective pullback within an uptrend, whereas a decisive break below $90 would signal a deeper correction. In the short term, the price action has shifted from a strong rally to a weak, volatile phase; however, with medium-to-long-term moving averages (50-day and 100-day) still positioned below the price, the major trend remains bullish. This movement is classified as a high-level pullback rather than a trend reversal.
From a technical perspective, the daily WTI crude oil chart displays a pattern of high-level volatility. Since rallying from a low near $83.40 in early September, the price has established a clear upward trend, though it pulled back this week after peaking at $96.57. The MACD indicator remains above the zero line, but the red histogram bars are contracting, signaling a weakening of upward momentum. Regarding the moving average system, the 5-day, 10-day, and 20-day moving averages remain in a bullish alignment; however, the price is currently trading near the 23-day moving average of $91.80, signaling a potential adjustment in the short-term trend. A key support level lies near the psychological $90 mark—a significant threshold from a previous breakout—with the next support level at $87.26 (the 40-day moving average). Resistance is anticipated in the $96.57 (last week's high) to $97.76 (September 18 high) range, an area of selling pressure established by highs over the past two weeks.
Consider going long on crude oil today at $91.20; stop-loss: $91.00; targets: $93.00, $94.00.
Spot Gold
Heading into the weekend, the price of gold stood at approximately $4,300 per ounce and is expected to decline by more than 1% this week. It faces pressure from a strengthening US dollar and surging Treasury yields, driven by market expectations that the Federal Reserve may need to raise interest rates further to curb inflation. On Thursday, yields on 10-year and 30-year US Treasury bonds climbed to their highest levels since 2007 and 2004, respectively, while the US dollar rose to a near two-month high. This volatility was triggered by stronger-than-expected US economic data and high oil prices, which stoked concerns regarding persistent inflation and higher interest rates. Markets currently estimate a roughly 67% probability of a Federal Reserve rate hike in October, following last week's rate increase—the first in three years. Meanwhile, oil prices retreated following reports that the US and Iran are considering a phased agreement that could reopen the Strait of Hormuz and lift the US blockade on Iranian ports. Gold prices touched a one-week low near $4,275 per ounce last Thursday, pressured by rising oil prices and a shift toward a hawkish stance by the Federal Reserve, which heightened market expectations for further interest rate hikes; traders currently price in a 69% probability of a Fed rate hike in October. Although gold is traditionally viewed as an inflation hedge, rising interest rates diminish its appeal. The US dollar's rise to a two-month high also weighed on gold prices, making the dollar-denominated metal more expensive for overseas buyers; meanwhile, the yield on the US 10-year Treasury note hovered near a 20-year high, increasing the opportunity cost of holding non-yielding gold. The support level established recently near $4,235 per ounce is the first key level to watch; a breach below this could trigger a further pullback, shifting market focus back to the $4,000 region seen between June and July.
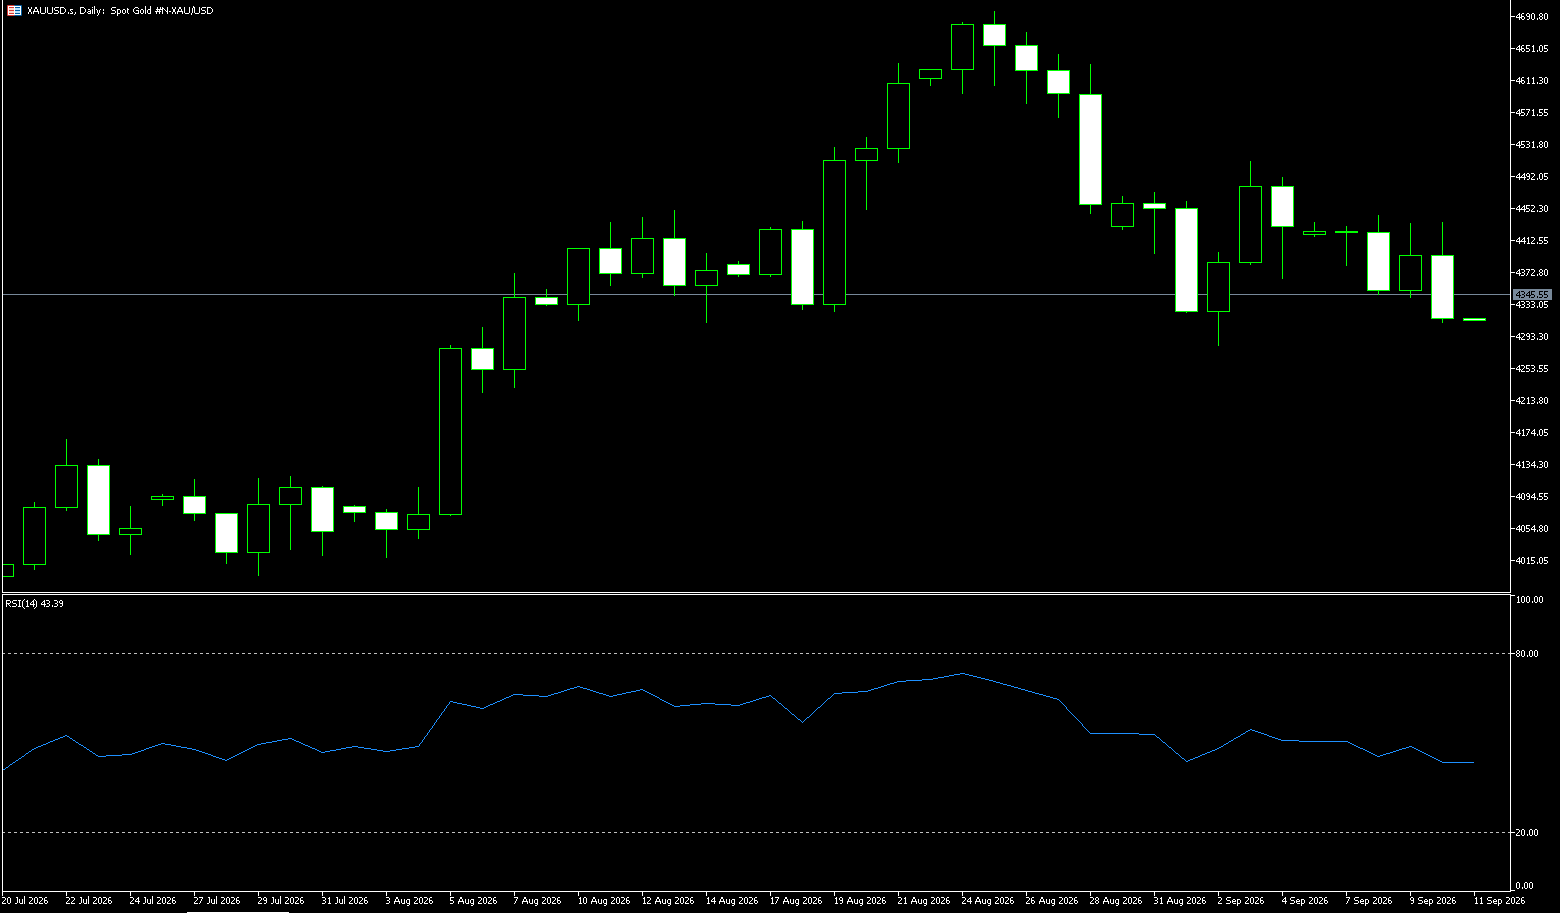
Last week, gold closed with a bearish candle, recording a weekly decline of over 1%; prices broke lower step-by-step from the week's rebound high, closing below the psychological $4,300 mark. Weekly moving averages turned downward, signaling a shift in the short-term trend toward a bearish bias. The weekly RSI retreated from above 50 to around 46—stopping short of oversold territory—suggesting bearish momentum could persist, though a short-term correction from the oversold state is anticipated. Key drivers included rising US real Treasury yields and a strengthening dollar, alongside concentrated long-position liquidation; rallies above $4,320 were consistently suppressed by bears. The $4,235 level served as a critical battleground between bulls and bears last week; while tested multiple times, it was not decisively broken. A sequence of small bearish candles and a long-lower-shadow candle (indicating a probe for a bottom) showed signs of halting the decline, yet there were no signals of stabilization or reversal—indicating weak resistance rather than a trend reversal. Consequently, last week was a period of pullback following the end of a rebound, characterized by a bearish bias within a broad range-bound market. The 4,235 level serves as the core line of defense for the current pullback; holding this level would maintain a wide range-bound oscillation, whereas a decisive break below it would open the door for further downside.
The daily chart shows the gold price trading between the Bollinger Bands midline ($4,352) and the lower band ($4,237). The bandwidth has narrowed compared to the earlier surge, indicating that volatility has retreated from highs—though this does not necessarily signal a trend reversal. Gold is currently trading near the $4,300 psychological level, yet momentum indicators on the daily chart remain neutral-to-bearish, highlighting the fragility of current rebound attempts. The 14-day RSI hovers just below the 47 mark, while the MACD is approaching the zero line. Bulls have so far been capped below $4,300, with initial resistance at the $4,235 level—a key battleground between bulls and bears last week that has repeatedly stifled upward momentum this week. A confirmed break above these levels would alleviate downward pressure and shift market focus to the Bollinger midline at $4,352; a further breakout would target the $4,400 mark. On the downside, $4,236 (the lower Bollinger Band) acts as key support. If this level fails, the previous resistance zone around the $4,200 round number could become a target ahead of the lows seen in late July and early August, the latter sitting just above the $4,000 psychological level.
Consider going long on gold at $4,280 today; stop-loss at $4,275; targets at $4,320 and $4,330.
AUD/USD
The Australian dollar depreciated to around $0.70, hitting a seven-week low, as a strengthening US dollar and a renewed sell-off in global bond markets weighed on risk-sensitive currencies. Although Australia added a better-than-expected 39,500 jobs in August—far exceeding the forecast of 20,000—the unemployment rate rose to 4.6%, its highest level in five years, highlighting the complexities of labor market conditions. This report was the final major economic data release ahead of the Reserve Bank of Australia’s (RBA) September 28–29 meeting; persistent inflation risks have raised the possibility of further rate hikes by the central bank. Markets price in a 95% probability of a 25-basis-point hike to 4.60% in September, with rates potentially peaking around 5.10%. Meanwhile, yields on 10-year and 30-year US Treasuries climbed to their highest levels since 2007 and 2004, respectively, and the US dollar rose to a near two-month high as strong US economic data and high oil prices stoked concerns about inflation and higher interest rates.
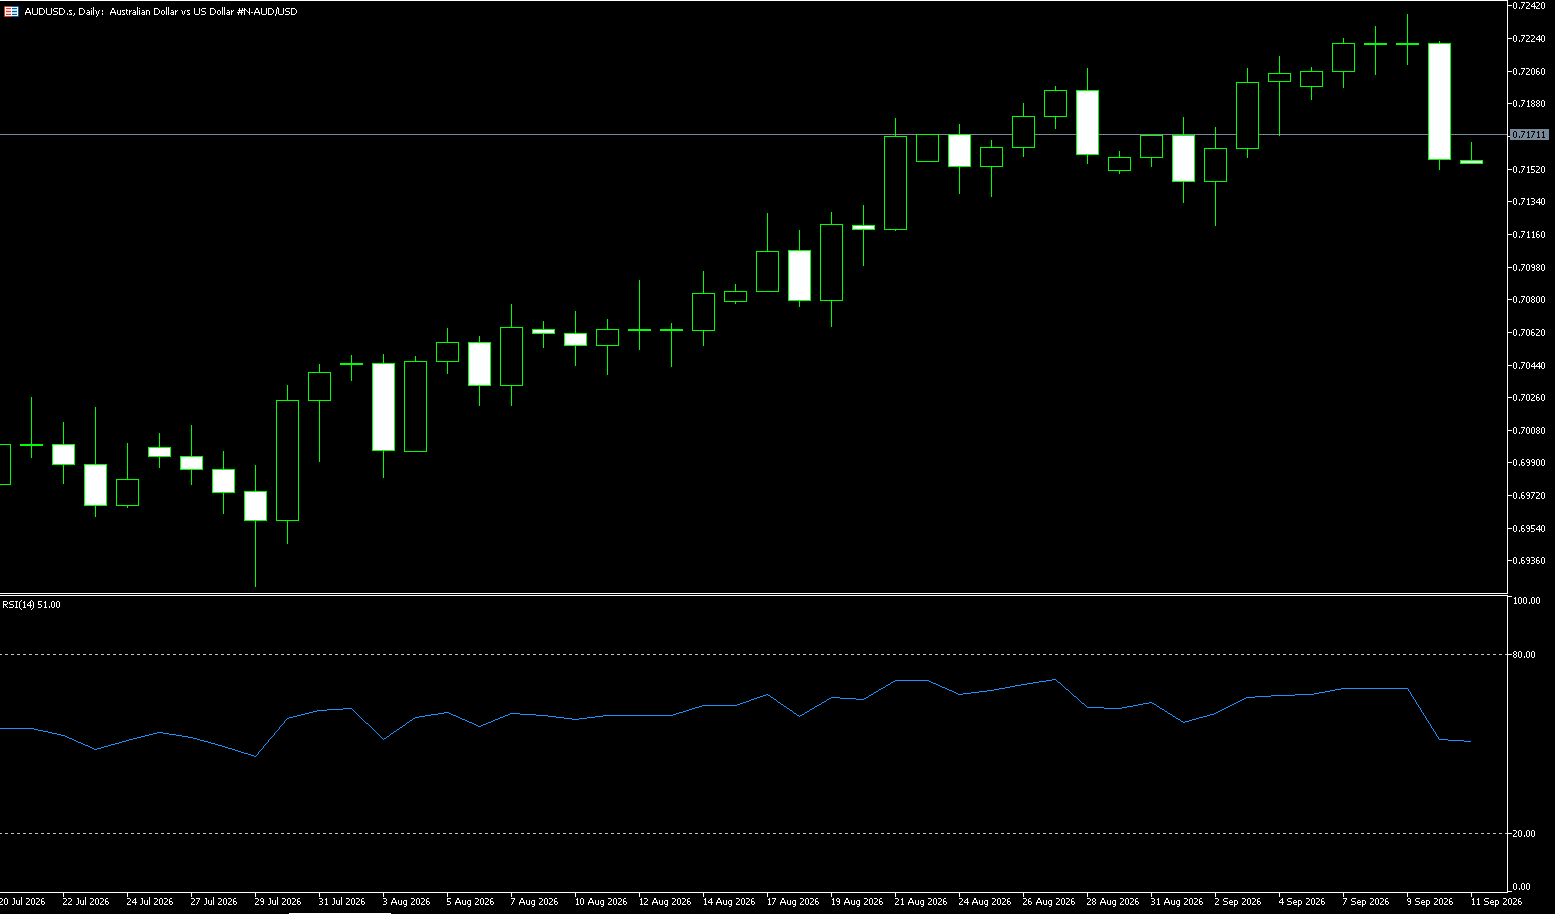
Last week, the AUD/USD pair extended its decline, touching a low of 0.7005—its weakest level since August 5. As the pair hit fresh lows, Australia's latest employment data became a key reference point for markets assessing the RBA's policy path. The AUD/USD has underperformed in recent weeks as traders grow increasingly convinced that the Federal Reserve will raise interest rates further this year; the probability of the Fed hiking rates at both of its remaining policy meetings this year stands at nearly 58%. Looking ahead, the next major catalyst for AUD/USD will be the Reserve Bank of Australia’s (RBA) monetary policy statement on Tuesday. Market experts believe the likelihood of an RBA rate hike at next week's meeting has increased following the upbeat August employment figures released on Thursday. Last week, the AUD/USD pair trended lower amidst volatility, with bearish sentiment dominating; prices weakened steadily, touching the 0.7000 level—a near seven-week low. The price action remained within a descending channel, posting consecutive bearish closes, while both the 20-day and 50-day moving averages sloped downward, exerting significant resistance. The MACD remained below the zero line, indicating dominant bearish momentum. Although the RSI briefly dipped into the oversold zone (below 30)—suggesting a potential short-term correction—the overall trend structure did not reverse, and any rebounds remained weak. Market dynamics were characterized by a strengthening US dollar weighing on commodity currencies, alongside weakness in iron ore prices and risk sentiment; price movements were primarily driven by the US Dollar Index, with rebounds lacking strength and facing heavy selling pressure at higher levels. The broader bearish outlook remains intact; for the coming week, the baseline expectation is for low-level consolidation and a corrective rebound from oversold conditions. However, a pullback is likely if rebounds encounter resistance, and the short-term bearish structure will only shift if the price establishes a firm footing above 0.7120.
On the daily chart, AUD/USD trades at 0.7020. The short-term tone remains bearish, as the spot price sits below the 20-period exponential moving average (EMA) of 0.7108 and several Fibonacci retracement levels acting as overhead resistance. The pair has fallen below both the 50.0% Fibonacci retracement level (0.7052) and the 38.2% level (0.7096). Meanwhile, the 14-day RSI stands near 36.56, suggesting that bearish momentum is building rather than being fully exhausted by oversold conditions. On the downside, initial support lies at the 61.8% Fibonacci retracement level (0.7008), followed by the 78.6% level (0.6945) and the 100% retracement starting point (0.6865). On the upside, initial resistance lies at the 50.0% Fibonacci retracement level of 0.7052, followed by the 38.2% level at 0.7096 and the 20-period EMA at 0.7108; the 23.6% retracement level at 0.7151 marks further resistance for any sustained rebound attempt.
Consider going long on the AUD at 0.7010 today; stop-loss: 0.7000; targets: 0.7050, 0.7060.
GBP/USD
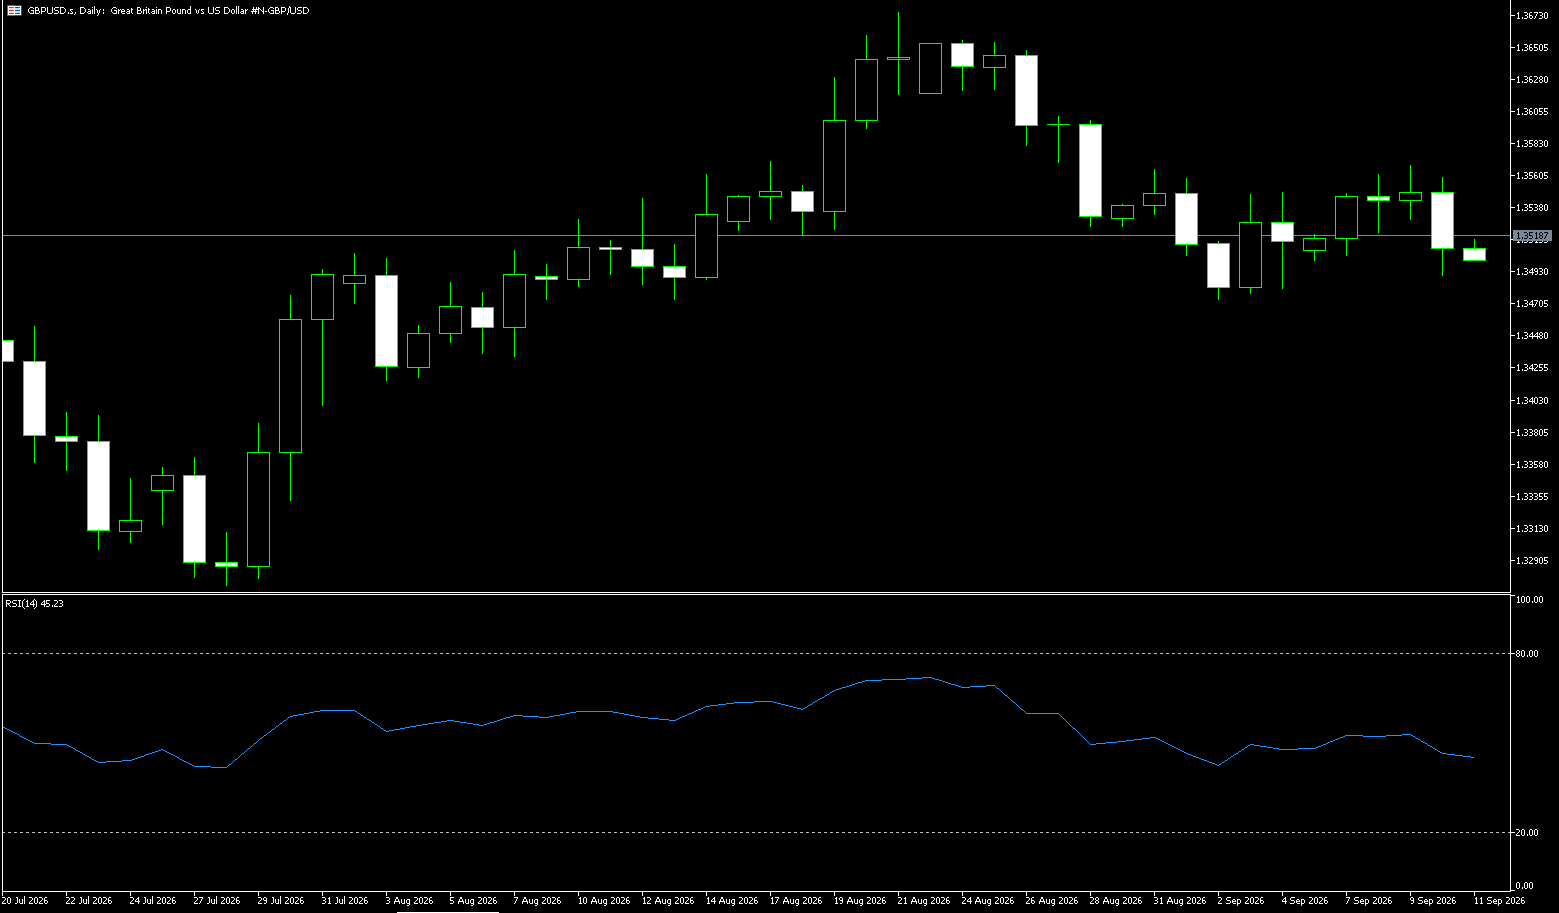
Sterling weakened further to just above the $1.32 level—a three-month low—as investors digested fresh comments from Bank of England policymakers, while a strengthening US dollar reflected rising market expectations for further Federal Reserve rate hikes this year. Rising oil prices also weighed on the economic outlook. Bank of England Deputy Governor Clare Lombardelli stated on Thursday that interest rates might need to rise if energy prices remain high, barring clear evidence of economic weakening. Last week, Lombardelli noted that the case for a rate hike was strengthening, having been part of the 6-3 majority that voted to keep rates at 3.75%. Meanwhile, Monetary Policy Committee member Swati Dhingra—considered one of the more dovish policymakers—indicated that inflation expectations were not yet a cause for concern. Markets continue to anticipate a high probability of a 25-basis-point rate hike by the Bank of England in November. In the US, investors have increased their bets on further Federal Reserve rate hikes following hawkish remarks from policymakers and stronger-than-expected Purchasing Managers' Index (PMI) data.
GBP/USD saw a brief rebound to around 1.3250, but the overall trend remains weak. Sterling is currently being pulled by two opposing forces: on one hand, UK interest rate markets continue to price in expectations for further rate hikes; on the other, strong US economic data and persistent emphasis on inflation risks by Fed officials have allowed the US dollar to regain its interest rate advantage. Against the backdrop of a widening gap in policy expectations between the US and the UK, the scope for a short-term rebound in Sterling is limited. Meanwhile, Federal Reserve policy signals remain hawkish; further policy adjustments may still be required to curb inflation. Earlier this week, Richmond Fed President Tom Barkin and Boston Fed President Susan Collins also supported near-term rate hikes, emphasizing that inflationary pressures persist. Should US employment and inflation data remain resilient, market expectations for further Federal Reserve policy tightening could intensify, providing additional support for the US dollar.
Last week, the GBP/USD pair was dominated by bearish sentiment, closing with a large bearish candle on the weekly chart. Prices consistently broke below short-term moving averages (5, 10, and 20-day), which formed a bearish alignment and continued to slope downward, driving the price to successive new lows. Trading remained below the 50-day moving average, with the 9-day moving average near 1.3334 acting as strong dynamic resistance against rebounds. The MACD histogram continued to expand, indicating dominant bearish momentum. The RSI dipped into the oversold zone (below 30); while bears remain in control, the oversold condition suggests a potential short-term corrective rebound rather than a trend reversal. Prices traded consistently below the Bollinger Bands' middle line (1.3418), which served as the short-term bull-bear dividing line; multiple rebound attempts met resistance and retreated. These rebounds represent technical pullbacks within a bearish trend; no reversal signal has yet emerged. Meanwhile, a strengthening US dollar and rising Treasury yields, combined with weak UK economic data, kept the pound under pressure; repeated attempts to test resistance levels last week failed, and the price continued to probe lower lows.
The daily chart structure remains bearish, with GBP/USD trading below key moving averages and critical Bollinger Band levels; the overall downward trend remains intact. Immediate resistance lies at the 1.3275–1.3278 zone (the lows from July 28–29). If the exchange rate can firmly reclaim this level, a rebound might test the 9-day moving average near 1.3334 and the previous week's high near 1.3400—a zone that constitutes significant resistance. For downside support, watch the 1.3200 level first (a psychological support level), followed by the June 24 low near 1.3140; a break below this would target 1.3100 (a round-number level). As the daily RSI is already in oversold territory, short-term attention should be paid to both a potential trend-driven breakdown caused by further US dollar strength and a rapid rebound triggered by the oversold conditions.
Consider going long on GBP at 1.3213 today; stop-loss: 1.3200; targets: 1.3260, 1.3270.
USD/JPY
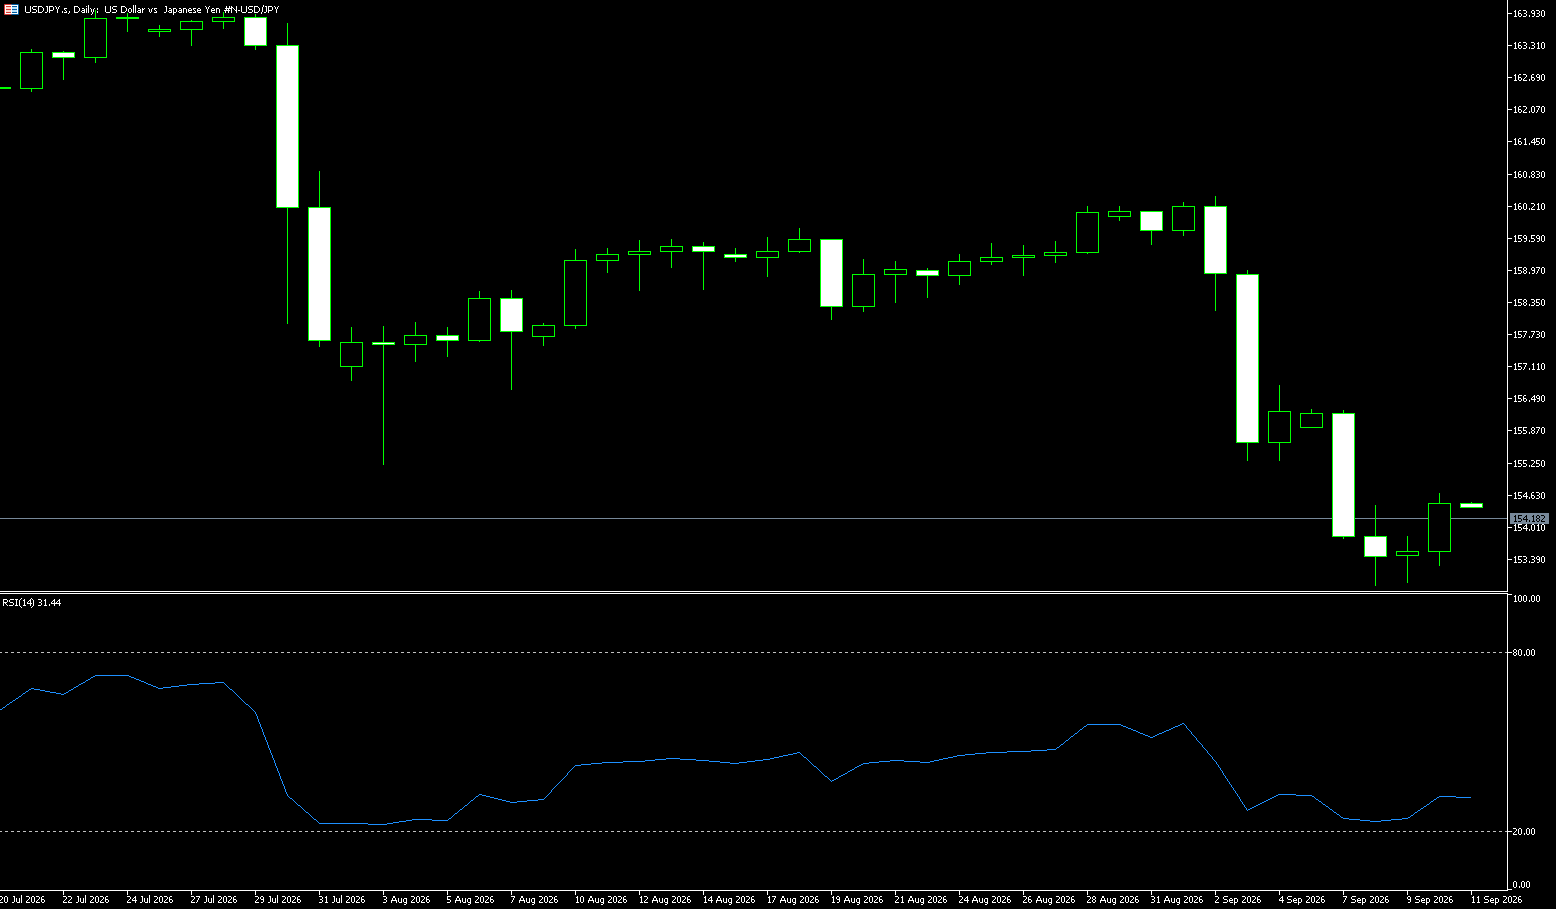
Late last week, the yen appreciated to around 157.30 per dollar on Friday, recovering from a two-week low and snapping a five-day losing streak; the USD/JPY pair recouped losses incurred from earlier market interventions this month. Price action was primarily driven by US Treasury yields and the US-Japan interest rate differential, with US economic resilience boosting expectations for Federal Reserve rate hikes while Japan's economic PMI weakened. Technically, the 158 level emerged as a key short-term watershed; the pair peaked at 158.86, a high not seen since September 3. Although the Bank of Japan has signaled a hawkish stance and there remains potential for currency intervention by the Japanese Ministry of Finance and the US Treasury, the primary driver of the USD/JPY exchange rate currently lies with the US. US Treasury yields have surged again, and the market has raised its expectations for Fed rate hikes—betting on another 3.5 hikes before next June—causing the USD/JPY exchange rate to stage a strong recovery in tandem with the widening interest rate spread.
Correlation analysis clearly confirms the linkage between US Treasury yields and the USD/JPY pair; over the past week, the correlation coefficient between the pair and the US 2-year Treasury yield rose to +0.85, while the correlation with the US-Japan 2-year Treasury yield spread approached +0.90. Although the figure has not reached extreme levels based on a five-day cycle, it is high relative to historical norms. Over the past month, the correlation between the USD/JPY exchange rate and short-term US Treasury yields has steadily strengthened, while the short-term volatility caused by foreign exchange intervention earlier this month has gradually subsided. This implies that traders must closely monitor fluctuations in short-term US Treasury yields, as the US Treasury market serves as the primary signal source for the USD/JPY exchange rate. Earlier this month, the exchange rate tested support below the 153 level; the subsequent rebound was driven primarily by rising US Treasury yields and a widening interest rate differential.
Last week saw a continuation of the bullish trend with a fluctuating upward trajectory; the rate briefly tested the 158.86 resistance level. After hitting a high on Thursday, it retreated rapidly on Friday—settling near 158—due to statements from Japanese and US officials and mounting expectations of intervention. The weekly candle closed as a bullish candle with a long upper shadow, indicating a pattern of a high-level surge followed by a pullback and profit-taking by bulls. The price had previously climbed steadily along the 20-day moving average (156.42), but with the RSI approaching the 50 level, short-term bullish momentum became exhausted, triggering a correction. While the daily price center has shifted upward, the long upper shadow signals heavy selling pressure above 159, and the 160 mark represents a zone of strong policy-driven resistance. Rising US Treasury yields and the USD/JPY interest rate spread continue to support the bulls; however, sudden warnings regarding intervention risks on Friday prompted the market to reduce long positions and lock in profits, leading to a rapid pullback as technical bullish sentiment clashed with policy risks.
Technically, looking at the daily chart, the USD/JPY pair established a "double bottom" in the 152.90–153.00 range early this month and subsequently embarked on a strong upward trend, breaking through the 158 level to reach a high of 158.86. However, a rapid pullback in the crude oil rally dragged the exchange rate down, causing the price to retreat to the 158 level; this level has thus become the key short-term battleground between bulls and bears. On the downside, initial support lies at the 157.00 round number, followed by a critical support level at 156.68—a point that marks both the interim low from August 7 and the 50% Fibonacci retracement of the range between the September 2 high and September 8 low. Further downside targets include the 20-day moving average at 156.46 and the 156.00 round number. Regarding resistance, the pair faced selling pressure near last Friday's high of 158.86. A decisive break above this level would extend the bullish trend, potentially allowing the rate to test the 160 psychological level or even push higher toward the 160.50 mark (the upper Bollinger Band).
Consider shorting the USD at 157.45 today; stop-loss: 157.60; targets: 156.50, 155.00.
EUR/USD
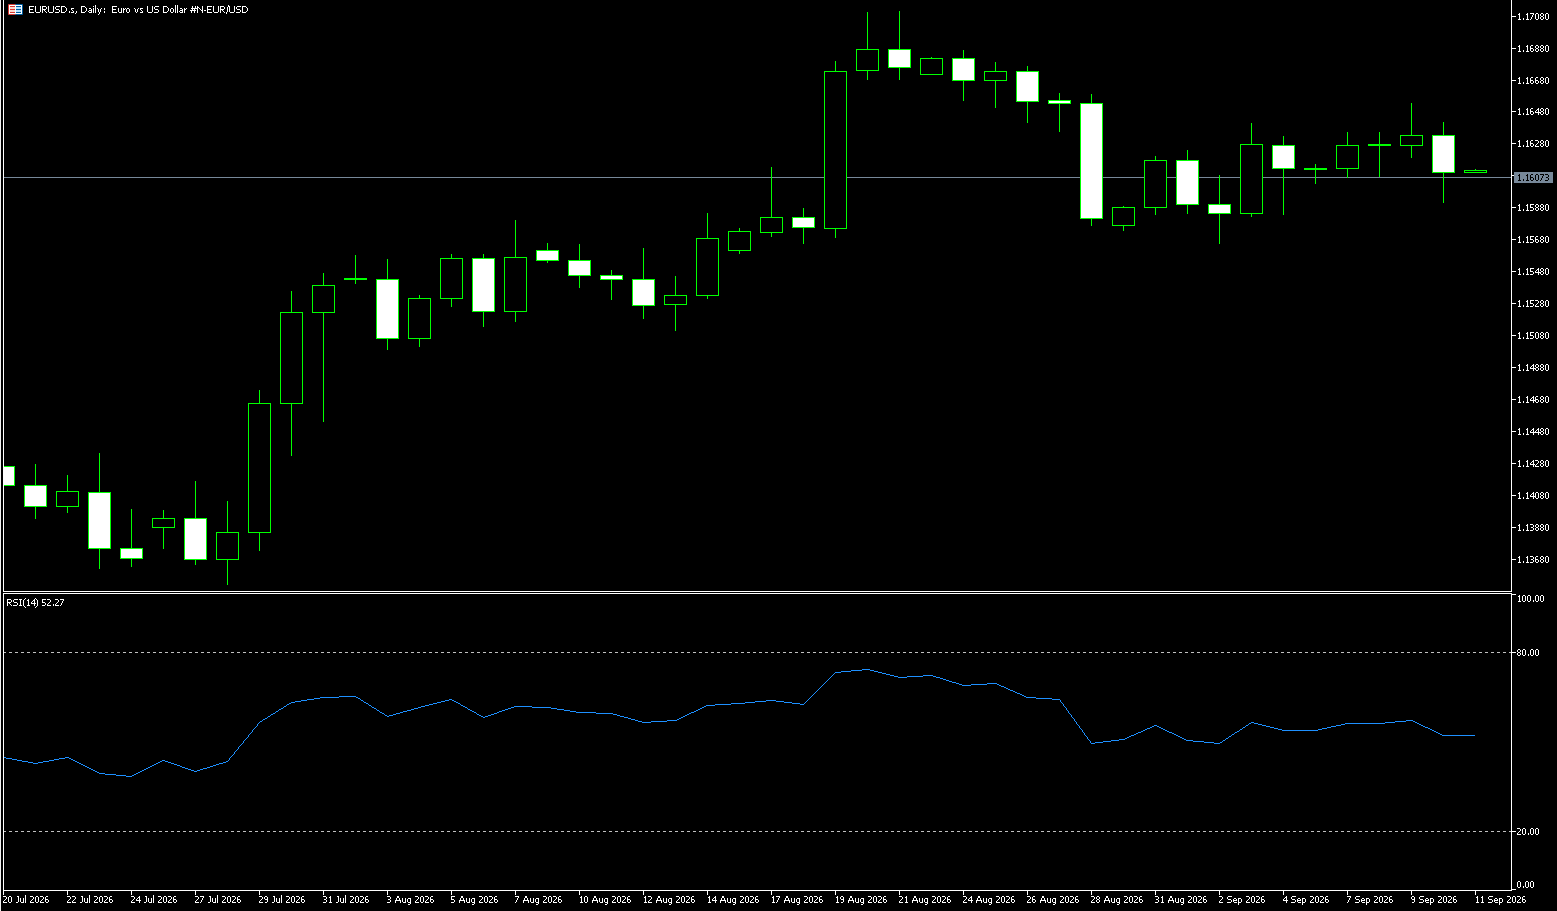
Last week, the Euro remained below $1.14, hovering near two-month lows as the US dollar strengthened amid market expectations of further Federal Reserve rate hikes this year—driven by stronger-than-expected US PMI data and a series of hawkish comments from Fed policymakers. Ongoing uncertainty regarding US-Iran negotiations and rising oil prices also exerted pressure on risk-sensitive assets. Meanwhile, European data showed that German business confidence improved more than expected in September, reaching its highest level in over three years, following stronger-than-anticipated PMI figures released on Wednesday. Private sector activity in the Eurozone expanded at its fastest pace in nearly three and a half years, further fueling market expectations for additional monetary tightening by the European Central Bank (ECB). Money markets now anticipate at least one 25-basis-point rate hike from the ECB by year-end, with a roughly 40% probability of a second hike. Better-than-expected US data has not only directly bolstered the US dollar by raising interest rate expectations but has also reinforced its appeal as a safe-haven asset by dampening risk appetite and tightening financial conditions. Cross-asset reactions clearly indicate that the unexpected resilience of the US economy is shifting global capital flows. Rising bond yields have pressured valuations, while stock market pullbacks have amplified risk-aversion sentiment. Currencies such as the euro have weakened against the dollar despite their own hawkish data, highlighting the dominant role of the US growth advantage. Tightening financial conditions may weigh on risk assets going forward and test the scope for policy coordination among central banks as they address a potential resurgence in inflation. Overall market dynamics suggest that US data surprises are becoming a key driver of short-term exchange rate and interest rate volatility; investors should closely monitor how subsequent inflation and employment data influence policy expectations.
Last week, the EUR/USD pair continued its downward trend, characterized by low-level oscillation following a major decline, with the trading range steadily shifting lower. After a brief, modest rebound early in the week met resistance near 1.1450, the pair retreated again; it traded within a narrow 1.1350–1.1400 range during the latter half of the week and closed with a bearish weekly candle. Daily moving averages formed a bearish crossover signal, and the price remained below all medium- and long-term moving averages, confirming a clear bearish trend. The 14-day RSI fell to around 26.45, entering oversold territory and suggesting a potential need for a technical rebound, though an oversold condition does not guarantee an immediate reversal. The MACD remained below the zero line with persistent bearish bars; there was no clear bullish divergence, and while downward momentum had slowed, it had not reversed. In summary, last week’s market action was characterized by "bottoming out" at low levels within a broader bearish trend. The US dollar strengthened—supported by hawkish remarks from Federal Reserve officials—thereby suppressing the euro; German IFO data triggered a brief bullish impulse, but it lacked sufficient strength, and any rebounds were quickly stifled by bears, marking them as weak rallies. On the daily chart, EUR/USD has continued to trade below the 9-day (1.1446) and 14-day (1.1503) simple moving averages (SMAs), both of which act as overhead resistance. Trading below these key daily moving averages reinforces a short-term bearish bias, although the latest Relative Strength Index (RSI) reading of 25.47 indicates oversold conditions, which may slow the decline rather than trigger a clear reversal. On the downside, initial support lies at the lower Bollinger Band (1.1357); a break below this level would target the 1.1300 psychological support level, where selling pressure might pause. On the upside, initial resistance is found at the 9-day SMA (1.1446), followed closely by the psychological 1.1500 level and the 14-day SMA (1.1503), which will likely cap any significant corrective rebound for the time being.
Consider going long on the Euro at 1.1378 today; Stop Loss: 1.1365; Targets: 1.1440, 1.1430.
Stock Analysis:
Australia ASX 200 Stock Index
Market Overview:
The Australian ASX 200 index fell 37 points (0.4%) on Friday to close at 8,665, marking its second consecutive day of decline as the market turned cautious ahead of the Reserve Bank's policy decision next week. Persistent inflation has fueled expectations of further rate hikes—following three increases earlier this year—with August inflation data due soon after July's figures exceeded expectations and remained above the central bank's 2–3% target range. Meanwhile, August labor data sent mixed signals: the unemployment rate rose to a nearly five-year high of 4.6%, even as employment numbers grew beyond expectations. In the US, the summit between President Trump and Chinese leader Xi Jinping failed to yield breakthroughs on key geopolitical issues, although both sides extended their trade truce.
Most sectors declined, led by technology, consumer services, and logistics. Mining and resource companies fell 4.8%, with significant losses seen in PLS Group (-3.7%), REA Group (-3.2%), and Xero (-2.8%). The index dropped 0.8% for the week, marking its fourth consecutive weekly decline.
Sector Performance:
Defensive sectors were the only ones to finish in the green—Consumer Staples (+0.78%) and Healthcare (marginally +0.09%)—reflecting a clear shift toward safe-haven assets.
Leading decliners: Technology, lithium mining, and wealth management sectors. Heavyweight mining and financial stocks faced pressure, dragging down the index; market breadth was poor, with the number of declining stocks consistently outnumbering advancers.
Technical Analysis:
The ASX 200 weakened steadily last week, falling approximately 0.76% overall. It hit a 15-week intraday low on Friday, continuing a volatile downward trend from its previous highs; the market is currently exhibiting a combination of a medium-term pullback and short-term oversold conditions. Index Structure: The index has decisively broken below the 200-day moving average (8829), signaling a weakening medium-term trend. In the short term, it remains under pressure below 8760; any rebounds have been weak and failed to establish a foothold above key resistance levels. Indicator Status: The RSI (14) has retreated to a low level, entering short-term oversold territory, though no clear bullish divergence has emerged yet. The MACD continues to decline below the zero line, indicating persistent bearish momentum, with expectations limited to a short-term corrective rebound. Key Drivers: Expectations for an RBA rate hike are intensifying, with the market pricing in a very high probability of a hike to 4.6% in September. Additionally, rising US Treasury yields and higher oil prices are fueling inflation concerns, thereby suppressing equity valuations.
Technical Outlook for Next Week: Core Stance: The dominant bearish trend remains intact. While there is potential for a short-term corrective rebound from oversold levels, the primary expectation is for range-bound consolidation to form a bottom rather than an immediate bullish reversal. Scenario Analysis: Base Case (Highest Probability): Consolidation and bottoming out at low levels. The index fluctuates within the 8574–8730 range; oversold conditions trigger a short-term rebound targeting the 8698–8730 zone. If the rebound stalls and retreats from this range, the index will retest lower support levels. Bullish Scenario: Bulls drive volume to firmly establish the index above 8760 and hold that level for more than two trading days. Short-term technicals improve, extending the rebound toward 8829 (200-day MA); however, this remains a corrective rebound rather than a trend reversal, as significant overhead selling pressure persists. Bearish Scenario: The index breaks below the 8574 support level and fails to recover by the close, opening up further downside potential toward the 8500 area and deepening the medium-term correction. Trading Strategy (Short-term Perspective)
Short-term Trading Approach (Futures / Index Derivatives)
Bearish Strategy (Primary Trend): Consider shorting if the price rebounds to the 8698–8730 resistance zone and shows signs of stalling, long upper shadows on candlesticks, or shrinking volume; place the stop-loss above 8760. Targets: 8635; if the level breaks, look toward 8607 / 8574.
Short-term Rebound Strategy (Light position; play only for an oversold correction—do not go "all-in" to bottom-fish): Consider a small long position if the price stabilizes upon retesting the 8574–8607 zone, accompanied by a reversal candlestick and an RSI bullish divergence signal. Stop-loss: below 8570; first take-profit zone: 8690–8720 (exit in batches at resistance levels; do not hold long positions for the long term).
Key Risk Warnings:
1. RBA Decision (Key event next week): Expectations regarding interest rate hikes are the primary variable; if the RBA is more hawkish than expected, the index could rapidly break below support levels; if dovish, a strong rebound could be triggered.
2. External Risks: Rising US Treasury yields, volatility in US equities, and climbing international oil prices are fueling global inflation expectations and weighing on risk assets.
3. Technical Risks: Although the RSI indicates oversold conditions, in a bear market, prices can remain oversold for extended periods; do not rely solely on oversold signals to take heavy long positions.
4. Sector Divergence Risk: An index rebound does not guarantee a simultaneous rebound for all individual stocks; volatility in heavyweight financial and mining sectors may amplify index fluctuations.
Dow Jones Industrial Average
Market Overview:
Wall Street concluded a week of intense volatility on Friday, with all three major US stock indices closing higher. A potential diplomatic breakthrough regarding the situation in the Middle East led to a noticeable pullback in international oil prices, temporarily easing market concerns about escalating energy-driven inflation. However, with U.S. Treasury yields hovering near 20-year highs and expectations of further Federal Reserve rate hikes persisting, investors remain cautious. By the close of trading, the Dow Jones Industrial Average had risen 478.64 points (0.93%) to 51,828.62; the S&P 500 gained 0.51% to 7,743.41; and the Nasdaq Composite rose 0.50% to 27,068.72.
For the week as a whole, U.S. equities demonstrated considerable resilience. The Dow rose 0.3%, the S&P 500 gained 1.2%, and the Nasdaq climbed 2%. Despite volatility in the bond market, a spike in crude oil prices, and rising expectations for Fed rate hikes, large-cap technology stocks continued to provide crucial market support. Developments in the crude oil market were a key factor in Friday's improved sentiment;
Iran's proposal of a new diplomatic initiative reignited hopes for the restoration of normal shipping traffic through the Strait of Hormuz.
Sector Performance:
Top Gainers: Disney, Visa, and Verizon (consumer, communications, and payments sectors). These benefited from a recovery in growth and defensive sectors driven by the pullback in U.S. Treasury yields. Microsoft's heavy weighting also contributed to Friday's rebound.
Top Laggards: Walmart, IBM, and Sherwin-Williams; the retail/consumer and traditional industrial sectors faced pressure. Sector Trends: The decline in U.S. Treasury yields and falling oil prices benefited Dow-weighted sectors such as consumer goods, utilities, and communications; however, volatility in the banking sector capped the extent of the market's rebound. Technical Analysis:
The index closed at 51,828.62 last Friday, up 0.28% (+145.98 points) for the week, snapping a three-week losing streak. Friday saw a significant 0.93% gain, marking a key bullish reversal candle for the week. During the first three trading days, the index continued to drift lower amidst weak volatility, hitting an intraday low of 51,339 and testing support at previous lows. After struggling at low levels on Thursday, a strong bullish candle emerged on Friday, reclaiming the 51,800 mark and forming a weekly candlestick characterized by a distinct long lower shadow—indicating a rebound from the lows. The index remains below the 20-day and 50-day moving averages (52,372 and 52,795, respectively), with short-term moving averages in a bearish alignment; however, it has held firm above the 100-day moving average, suggesting the medium-to-long-term trend has not fully deteriorated. Volatility range: 51,339–51,875. RSI: The weekly RSI stands at 43.56; while it has recovered slightly from oversold territory, it has not yet entered the strong zone, implying the rebound is merely a correction from an oversold state rather than a trend reversal.
Outlook for Next Week: Scenario analysis—Scenario A (Oscillating Rebound): The index holds the 51,600 support level at the open, breaks above 52,100, and targets a test of 52,370. Prerequisites: US Treasury yields continue to decline, oil prices remain on a downward trend, and heavyweight consumer/tech stocks continue to perform strongly. Neutral Scenario (Highest Probability; Range-bound Oscillation): Trading within the 51,340–52,100 range. Friday's rebound represents a correction from oversold levels; significant resistance from overhead moving averages suggests that any upward spikes are likely to face selling pressure and pullbacks, resulting in continued range-bound volatility. Bearish Scenario (Secondary Retest): The rebound lacks strength; failing to break above 52,100 and decisively dropping below 51,340 would trigger a renewed short-term pullback, testing the low-level support at 51,200. Indicator Perspective: The RSI has just recovered from lows and lacks the momentum for a sustained, one-sided rally; the bearish structure on the weekly chart remains intact, so the market is primarily viewed as undergoing a corrective consolidation. Last week, the Dow tested lows before closing with a bullish recovery candle, snapping a three-week losing streak; next week, the market is likely to oscillate within the 51,340–52,100 range. Significant resistance lies above at 52,100 and 52,370, while key support levels below are 51,600 and 51,340.
Trading Strategy:
Operational Strategy (Short-term perspective; suitable for Hang Seng Index / HSI Futures traders)
1. Long Strategy
• Entry Conditions: Stabilize near 51,600 with a bullish hourly candle confirming support; initiate a light long position. Place stop-loss below 51,300.
• Long Targets: First target at 52,080; look toward 52,370 upon a breakout. Scale out positions near 52,370; do not chase highs.
• Do not chase rallies above 52,100; resistance is dense overhead, resulting in a poor risk-to-reward ratio for chasing longs.
2. Short Strategy
• Entry Conditions: Encounter resistance in the 52,080–52,100 range, accompanied by a bearish divergence or a long upper shadow on the hourly chart; initiate a light short position. Place stop-loss above 52,250.
• Short Targets: 51,600; look toward 51,340 if broken. Gradually take profits in the low-level support zone; do not blindly anticipate a massive drop. Key Risk Warnings:
1. Core Macro Risk: Repeated rebounds in 10-year US Treasury yields act as the primary headwind; rising yields directly suppress the valuations of Dow Jones Industrial Average (DJIA) heavyweights. Additionally, geopolitical disturbances in the Middle East could drive up oil prices, dampening stock market rebounds.
2. Fundamental Risk: US inflation and employment data exceeding expectations could alter Federal Reserve rate-cut projections, triggering a rapid pullback in indices.
3. Technical Risk: The current movement is merely a rebound from oversold levels; a rebound does not equate to a trend reversal. Until the index stabilizes above the 50-day moving average, the broader trend remains weak, and the rebound could end abruptly, leading to a re-test of the lows.
4. Trading Risk Management: US stocks exhibit high overnight volatility and significant gap risk; strict stop-loss measures and position sizing are essential. Heavy positioning is prohibited in leveraged trading, and overnight holdings require safeguards against price gaps caused by unexpected geopolitical news over the weekend.
Disclaimer: The information contained herein (1) is proprietary to BCR and/or its content providers; (2) may not be copied or distributed; (3) is not warranted to be accurate, complete or timely; and, (4) does not constitute advice or a recommendation by BCR or its content providers in respect of the investment in financial instruments. Neither BCR or its content providers are responsible for any damages or losses arising from any use of this information. Past performance is no guarantee of future results.
Lebih Liputan





2026 © - All Rights Reserved by BCR Co Pty Ltd
Pendedahan Risiko:Instrumen derivatif diniagakan di luar bursa dengan margin, yang bermakna ia membawa tahap risiko yang tinggi dan terdapat kemungkinan anda boleh kehilangan seluruh pelaburan anda. Produk-produk ini tidak sesuai untuk semua pelabur. Pastikan anda memahami sepenuhnya risiko dan pertimbangkan dengan teliti keadaan kewangan dan pengalaman dagangan anda sebelum berdagang. Cari nasihat kewangan bebas jika perlu sebelum membuka akaun dengan BCR.
BCR Co Pty Ltd (No. Syarikat 1975046) ialah syarikat yang diperbadankan di bawah undang-undang British Virgin Islands, dengan pejabat berdaftar di Trident Chambers, Wickham’s Cay 1, Road Town, Tortola, British Virgin Islands, dan dilesenkan serta dikawal selia oleh Suruhanjaya Perkhidmatan Kewangan British Virgin Islands di bawah Lesen No. SIBA/L/19/1122.
Open Bridge Limited (No. Syarikat 16701394) ialah syarikat yang diperbadankan di bawah Akta Syarikat 2006 dan berdaftar di England dan Wales, dengan alamat berdaftar di Kemp House, 160 City Road, London, England, EC1V 2NX. Open Bridge Limited bertindak semata-mata sebagai pemproses pembayaran untuk BCR Co Pty Ltd dan tidak menyediakan sebarang perkhidmatan kewangan, perdagangan atau pelaburan bagi pihaknya. Peranan Open Bridge Limited adalah terhad kepada pemprosesan pembayaran.


 English
 简体中文
简体中文
 繁體中文
繁體中文
 Bahasa
Melayu
Bahasa
Melayu
 Tiếng
Việt
Tiếng
Việt
 ไทย
ไทย
 日本語
日本語
 한국어
한국어
 ភាសាខ្មែរ
 español