


0
US Dollar Index
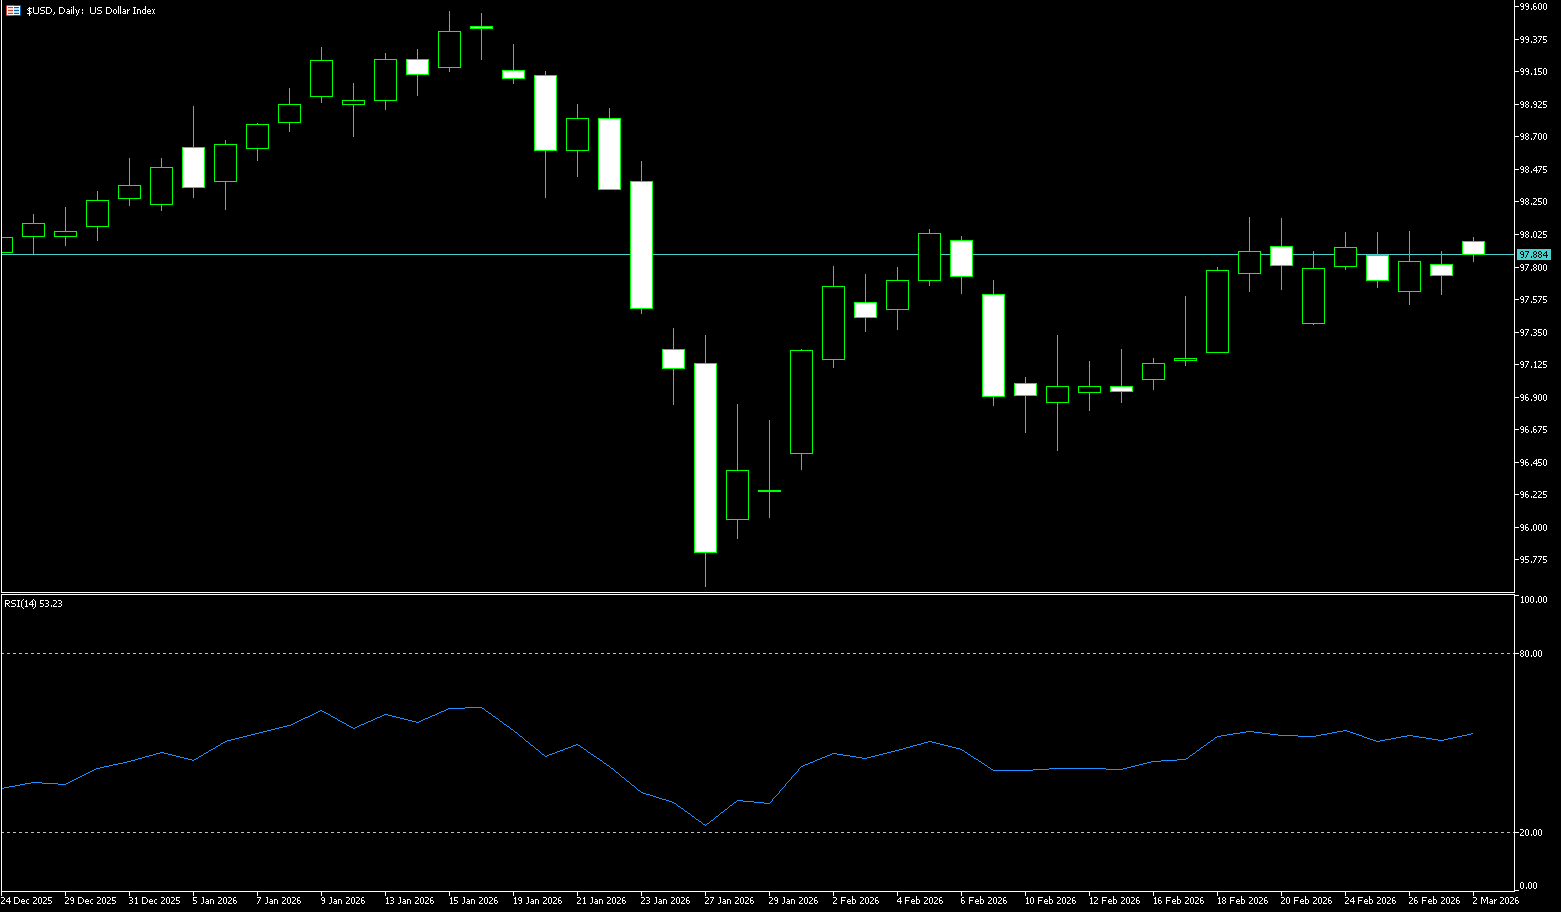
The US dollar index traded sideways between 97.35 and 98.00 throughout last week as investors awaited upcoming inflation data, which could influence expectations for Federal Reserve policy. Thursday's data revealed that both initial and continuing jobless claims were lower than expected, indicating a stable US labor market and continued employee retention. The Fed is expected to keep interest rates unchanged until at least June, as policymakers weigh high inflation against labor market risks. Investors are also focused on uncertainty surrounding US tariffs, following the Trump administration's indication that tariffs on some countries could be raised from 10% to 15%, while the US and Iran agreed to continue nuclear negotiations next week. The dollar is poised to rise by the end of the month, ending a three-month downtrend. On the other hand, in a midterm election year, the likelihood of a traditional safe-haven dollar surge is low, as Trump is expected to lose the House of Representatives. A bearish dollar seems to be the consensus, so what could go wrong? The simple answer is that many things can go wrong, leading to a traditional safe-haven rally that could trigger a dollar strengthening, but this seems unlikely in the midterm elections. The US midterm elections. Trump is expected to lose the House of Representatives, with a split government being the most likely outcome. We remain concerned about the risk of Trump losing the Senate, but given the map of this election, this goal is more difficult to achieve. This would leave the current administration in a phase of inaction, diminishing Trump's power. Tariffs will remain, but pressure on countries to commit to investment in the US may lessen after the midterm elections, which would be beneficial for emerging market currencies.
Last week, the US dollar index generally traded in a narrow range, showing a slightly bullish recovery pattern, primarily fluctuating between 97.35 and 98.00. The short-term technical outlook is neutral to slightly bullish, but lacks momentum for a unilateral breakout. Technically, last week's failure near 98.00 formed a bearish double top pattern on the daily chart. This pattern, formed after repeated failures near the 200-day simple moving average (98.35), confirms the negative outlook. However, bearish traders may choose to wait for a sustained break and confirmation below the 96.80-97.00 level before placing new bets. Regarding the moving average system, the short-term (5/10/20 days) trend turned upward and converged, with oil prices standing above all short-term moving averages, indicating a bullish advantage. The medium-term (60 days) 97.95–98.00 constitutes the strongest resistance this week, and multiple attempts to break through it have failed. As for the long-term (200/250 days) moving averages, they are still downward, and the medium-term downward trend remains unchanged, with the rebound being a correction. In addition, the daily technical indicator RSI (14): 50–55, just past the 50 bullish/bearish line, slightly bullish with weak momentum; while MACD: a golden cross above the zero axis, indicating weakening downward momentum and bullish correction. At present, the US dollar index seems to be at the 98.00 {market psychological threshold}. The index encountered significant resistance around 98.07 (the high of February 19th), an area that coincides with the monthly high. A break above this area could see it test the key 200-day simple moving average at 98.35, followed by the 100-day simple moving average at 98.55. Upwards from there is the 2026 ceiling at 99.49 (January 15th), all before the psychological level of 100.00. On the other hand, a break below the psychological level of 97.00 and the 97.07 (low of February 17th) could pave the way for a move towards the 2026 low of 95.56 (January 27th).
Consider going long on the US Dollar Index today near 97.55; Stop Loss: 97.45; Target: 97.90; 98.00
WTI Spot Crude Oil
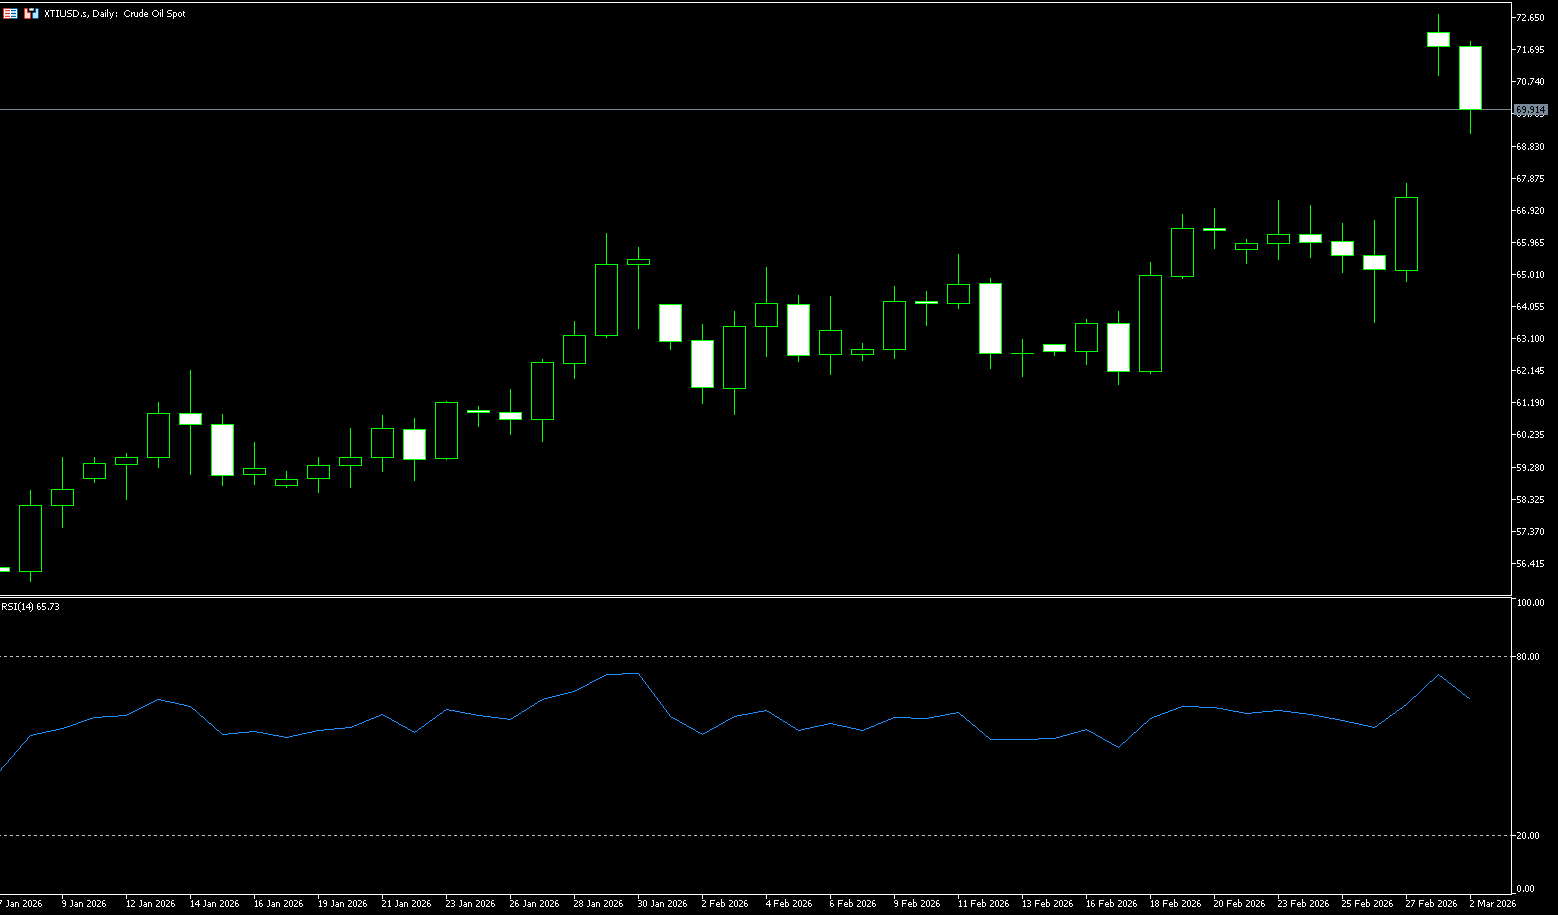
Last week, WTI crude oil prices fluctuated, rising to a near six-month high of $67.74, and are currently trading around $67.20 per barrel. Oil prices are expected to rise sharply when trading resumes this week, as the unprecedented US and Israeli strikes against Iran have escalated tensions in the Middle East and increased concerns about potential disruptions to global energy supplies. Prices have been supported by ongoing geopolitical tensions since the beginning of the year. On February 28, 2026, a day destined to go down in history, the geopolitical storm in the Middle East suddenly escalated. The coordinated military strikes by the US and Israel against Iran triggered a swift Iranian retaliation, launching missiles at multiple US military bases in the Gulf region. This series of events was like a bombshell dropped on the global oil market, instantly igniting investor panic about supply disruptions. WTI crude oil prices have fluctuated this year, rising to near a six-month high of around $67.74. But the deeper impact may have only just begun: Iran's crucial role in global oil supplies, its export infrastructure, and the strategic importance of the Strait of Hormuz mean that the aftershocks of this conflict directly impact the core of energy security.
Last week, WTI crude oil prices consolidated at high levels and traded within a range, with a core range of $63.60–$68.00. Technically, prices briefly broke below the short-term uptrend line, but remain within a medium-term consolidation channel, intensifying the battle between bulls and bears. Currently, the market is facing a triple whammy of weakening technicals, a large increase in EIA inventories, a stronger dollar, and easing tensions between the US and Iran. However, geopolitical risk premiums have not completely disappeared, limiting the decline. Therefore, the short-term consolidation pattern remains intact. The medium-term trend remains a large range-bound movement between $60 and $70. Regarding the moving average system: short-term (5/10/20-day moving averages) have flattened and turned downwards, with crude oil prices breaking below all short-term moving averages. The 50/200-day moving averages provide strong medium-term support; as long as they are not broken, the medium-term uptrend is not completely destroyed. The RSI (14-day): has fallen from the overbought zone at the beginning of the week to the neutral-to-strong zone of 63, with no clear oversold signal, indicating the correction is not yet complete. The MACD has formed a death cross above the zero line, with the green bars expanding, indicating increasing bearish momentum. Short-term volatility is weak. A break below $64.50-$64.00 (a densely traded area tested multiple times this week) would be the first line of defense. If the rebound is weak, a test of the $63.58 support level (last week's low) is more likely. A break below this level would further challenge the $62.34 (40-day moving average) and $62.05 (February 18th low) area. Key resistance levels to watch are $67.24 (last week's high) and $70.00 (a psychological level); if geopolitical risks escalate further, a test of the $71.56 (last March high) area cannot be ruled out.
Today, consider going long on crude oil around 67.10; stop loss: 67.00, target: 69.00; 70.00
Today, consider going long on crude oil around 67.10; stop loss: 67.00, target: 69.00; 70.00
Spot Gold
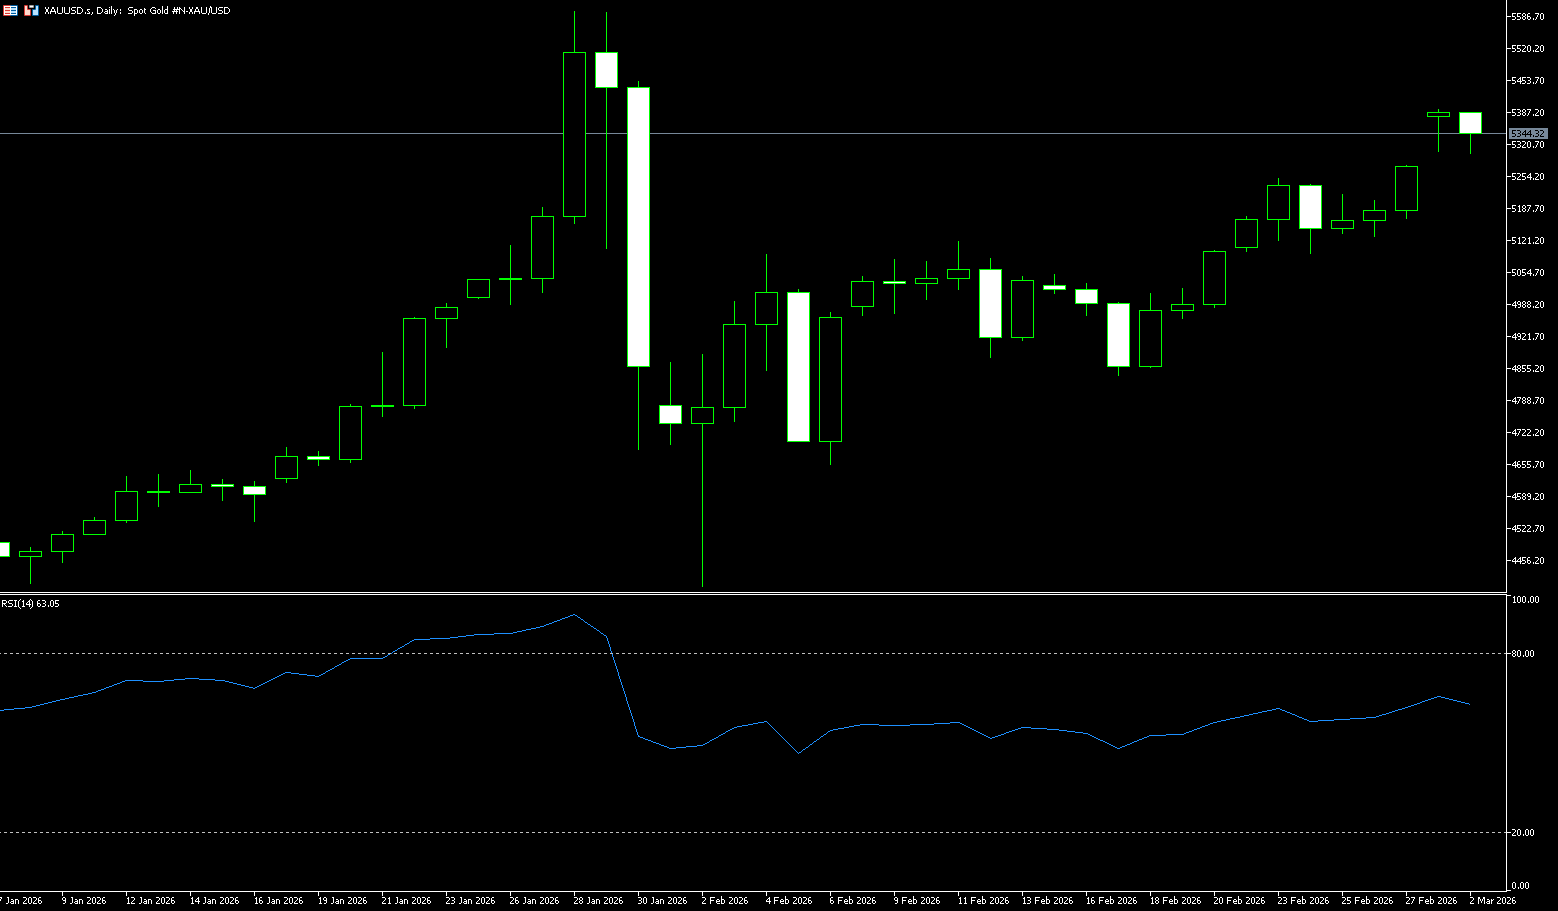
Last week, Gold prices have been consolidating at high levels, breaking through $5,200 per ounce and testing a two-month high of $5,265.50. Investors are weighing the impact of aggressive US trade policies against stubborn inflation data. Bulls, like tireless attackers, have repeatedly attempted to break through the $5,300 level, only to falter at each resistance point. This repeated testing has made the market appear anxious and sluggish, lacking a decisive catalyst in the short term, resulting in a sideways consolidation. However, this does not indicate a lack of strength among the bulls. On the contrary, the undercurrent of risk aversion and the persistent nature of inflation are building a solid defensive line for gold prices, significantly limiting the scope of each pullback. The current sideways movement is more like accumulating strength, awaiting the next trigger point. Beneath this seemingly calm surface, the logic of macro pricing is quietly being restructured. The core drivers of gold prices remain tightly centered on real interest rates and the liquidity environment. If the Federal Reserve's policy focus further shifts towards its "maximum employment target," and the core personal consumption expenditure price index stubbornly remains near 3%, then the upside potential for real interest rates will inevitably be limited. For gold, a non-interest-bearing asset, a decrease in holding costs is undoubtedly a significant positive. Considering common resistance and support levels on the chart, the area around $5400 can be seen as one of the important resistance zones above, while $5100 is a crucial support level that must be held in the short term.
Spot gold traded in a high-level consolidation pattern last week, with a core range of $5108 (9-day moving average) – $5300 (psychological level). The overall bullish trend for the US dollar remains unchanged, but it faces short-term technical corrections and delivery day disruptions. The daily chart shows high-level consolidation with decreasing volume, primarily consisting of small bearish/bullish candles and doji stars. The 5/10/20-day moving averages are in a bullish alignment, and the price has stabilized above them, indicating a medium-term upward trend. Short-term moving averages are flattening, suggesting weakening bullish momentum and a period of consolidation. The RSI (14) has fallen from the overbought zone (>70) to the 65-60 range, completing initial overbought correction and not yet entering bearish territory. The MACD histogram is shortening, and the two lines are flattening at high levels, indicating weakening bullish momentum, with no clear death cross, suggesting a consolidation phase. Currently, the price is fluctuating widely between the 9-day moving average (5,108) and the psychological level (5,300), showing a clear tug-of-war between bulls and bears, forming a converging triangle pattern with low trading volume, highlighting a consolidation phase. A rebound is expected if the price stabilizes above the multiple support levels of $5,265 (last week's high). If the price moves towards the 5,200 level, it will challenge the 5,300 level. A break above this level would target the 5,350-5,400 area. Conversely, if the support zone around 5,167 (last Friday's low) and 5,150 is breached, be wary of a deeper pullback to the 5,100 level and the 5,108 level (9-day moving average). A break below this level would target the psychological level of 5,000, and even risk a trend reversal.
Consider going long on gold around 5,260 today; Stop loss: 5.250; Target: 5,320; 5,350
AUD/USD
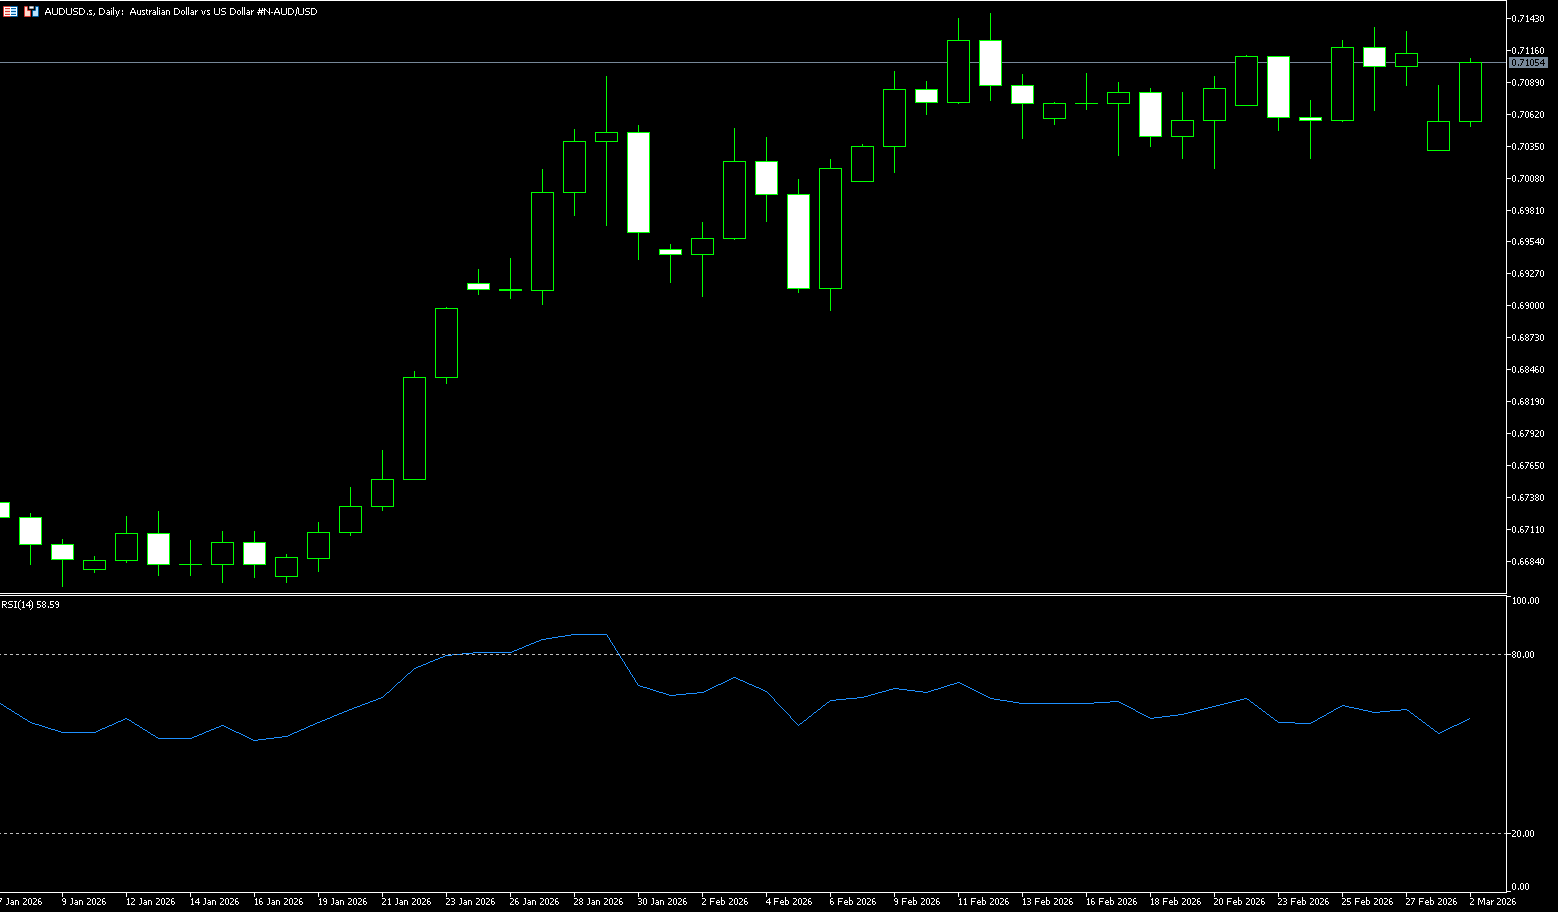
The AUD/USD attracted renewed buying last week and stabilized above 0.7100 in the second half of the week. The spot price appears poised for its sixth consecutive week of gains and remains within reach of the three-year high reached earlier this month. Before the end of last week... The Australian dollar traded slightly above US$0.7100 on Friday, near a more than three-year high, and is on track for its fourth consecutive monthly gain amid growing bets on a hawkish policy outlook. The currency is on track for a gain of about 2% in February and more than 6% year-to-date, making it the best-performing G10 currency, as stronger domestic economic conditions have boosted market expectations for further tightening by the Reserve Bank. Money markets are pricing in an 80% probability of a rate hike in May following a surprise rise in inflation in January, bringing the total tightening this year to 40 basis points. However, many economists believe the cash rate will peak around 4.10%, close to levels reached during the post-pandemic inflation cycle. Governor Michelle Block also reiterated that patience remains appropriate as the economy nears equilibrium, which has dampened expectations for an aggressive rate hike path. Meanwhile, The volatility of the US dollar is heavily influenced by alternating policy uncertainties and data repricing. Recently, the dollar weakened due to changes in tariff-related laws, with the market tending to reduce its long dollar exposure during periods of heightened uncertainty. However, the dollar subsequently recovered most of its losses, indicating that funds have not formed a unified one-sided view and are more likely waiting for a new catalyst. The future direction of the dollar still depends on shifts in risk sentiment and the repricing of interest rate paths triggered by high-weighted data such as employment and inflation.
From a micro-level technical perspective, the 0.7000 level for AUD/USD has become a crucial psychological and structural defense line that bulls must defend. As long as the exchange rate can hold firmly above this area during pullbacks, it indicates that the previous upward trend has not been broken, and the current sideways movement is merely a temporary consolidation. A pause during an uptrend. Conversely, a decisive break below 0.7000 could be interpreted by short-term investors as a sign of weakening trend momentum, forcibly opening up room for further correction. Technical indicators also signal caution. The MACD shows the red bars have weakened after converging, reflecting a shift from strong to moderate short-term momentum. Meanwhile, the RSI reading is around 64.71, in a neutral-to-strong range, lacking both significant overbought pressure and insufficient to signal a unilateral acceleration. This combination of technical indicators aligns with the current range-bound trading pattern: the currency pair is no longer driven solely by technical momentum but heavily reliant on news and interest rate expectations to determine its direction. The first target below is 0.7059 (the 20-day moving average). The psychological level of 0.7000 will become the next precarious support zone. On the upside, the 0.7141-0.7157 area (February 2023 high + technical resistance) is a key resistance zone in the near term. A close above this area could pave the way for a future rise to the 0.7200 level. Only a break and hold above this level can signal the end of the consolidation and allow the price to continue its previous upward momentum.
Consider shorting the Australian dollar today around 0.7125; Stop loss: 0.7138; Target: 0.7080. 0.7070
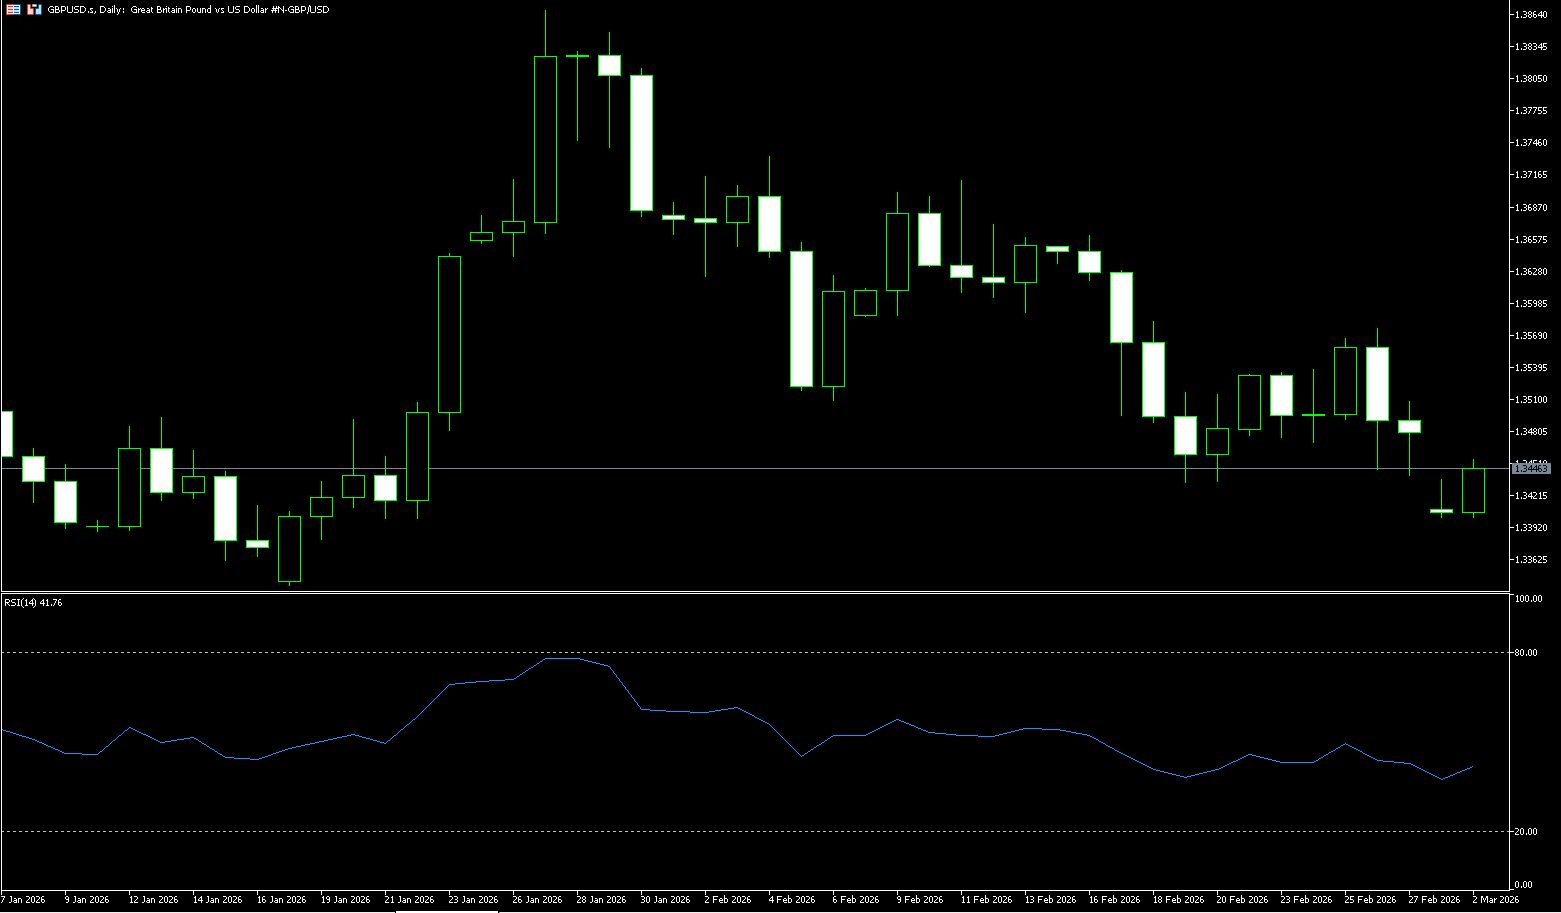
GBP/USD
Last week, the pound/dollar pair fell from a high of 1.3575 to a low near 1.3445. The pound's weakness was mainly driven by political uncertainty in the UK. The Manchester by-election is currently being counted. This election is seen as a crucial test of Prime Minister Keir Starmer's political approval rating. Market analysts believe that a poor performance by the ruling party could increase domestic political pressure and drag down expectations of capital inflows into the pound. Mitsubishi UFJ Financial Group pointed out that if the ruling party's approval rating continues to decline, future local election risks could further impact market confidence. Regarding the dollar, uncertainty surrounding tariff policies limited its potential for unilateral strengthening. The US Supreme Court ruled that the emergency powers tariff framework used by the Trump administration did not fully support its policy system. Subsequently, US President Trump announced a 10% tariff on global imports and threatened to raise it to 15% in the future. This policy back-and-forth reduced market risk appetite but also increased short-term volatility in the dollar. Overall, the pound was dragged down by political risk, while the dollar was supported by interest rate expectations, resulting in a short-term weak and volatile exchange rate. Currently, the pound/dollar exchange rate is primarily driven by both political risk and monetary policy expectations. British political uncertainty has diminished the pound's appeal, while US inflation data and interest rate path have supported the dollar's performance. In the short term, the exchange rate is more likely to remain range-bound. If US inflation continues to rise, GBP/USD may face further pressure; if inflation falls, the pound may experience a technical rebound. The medium-term trend still depends on the UK economic fundamentals and the pace of Federal Reserve policy.
Last week, GBP/USD traded in a narrow range with a slightly weak consolidation pattern, with the core trading range between 1.3440 and 1.3580. The battle between bulls and bears intensified, and the technical picture showed a pattern of "support held, resistance difficult to break, awaiting a breakout." The daily chart structure shows that GBP/USD is generally trading within a medium-term downward channel, with the exchange rate gradually declining after encountering resistance near 1.3600. The short-term moving averages (5/10/20 days) are flat and converging, showing no clear direction. The 20-day moving average is acting as resistance around 1.3578 and 1.3575 (last week's high). Meanwhile, the medium-term moving averages (50/100 days) are diverging downwards, indicating the medium-term downtrend remains intact, although the downward slope has slowed, suggesting weakening bearish momentum. The MACD histogram is gradually contracting, indicating a slight easing of downward pressure. The RSI is around 43.32, in a weak but not oversold zone, suggesting the market has entered a consolidation phase. On the other hand, key daily support lies at 1.3445 (last week's low) and the 1.3447 (200-day moving average) area. A break below these levels could lead to a further test of the 1.3400 (psychological level). A further break would target 1.3344 (January 19th low). Resistance is located at 1.3550 (14-day moving average) and the 1.3600 (psychological level). A break above 1.3600 could lead to a short-term rebound towards 1.3671 (February 13 high).
Consider shorting the British pound today around 1.3490; stop loss: 1.3500, target: 1.3430; 1.3420
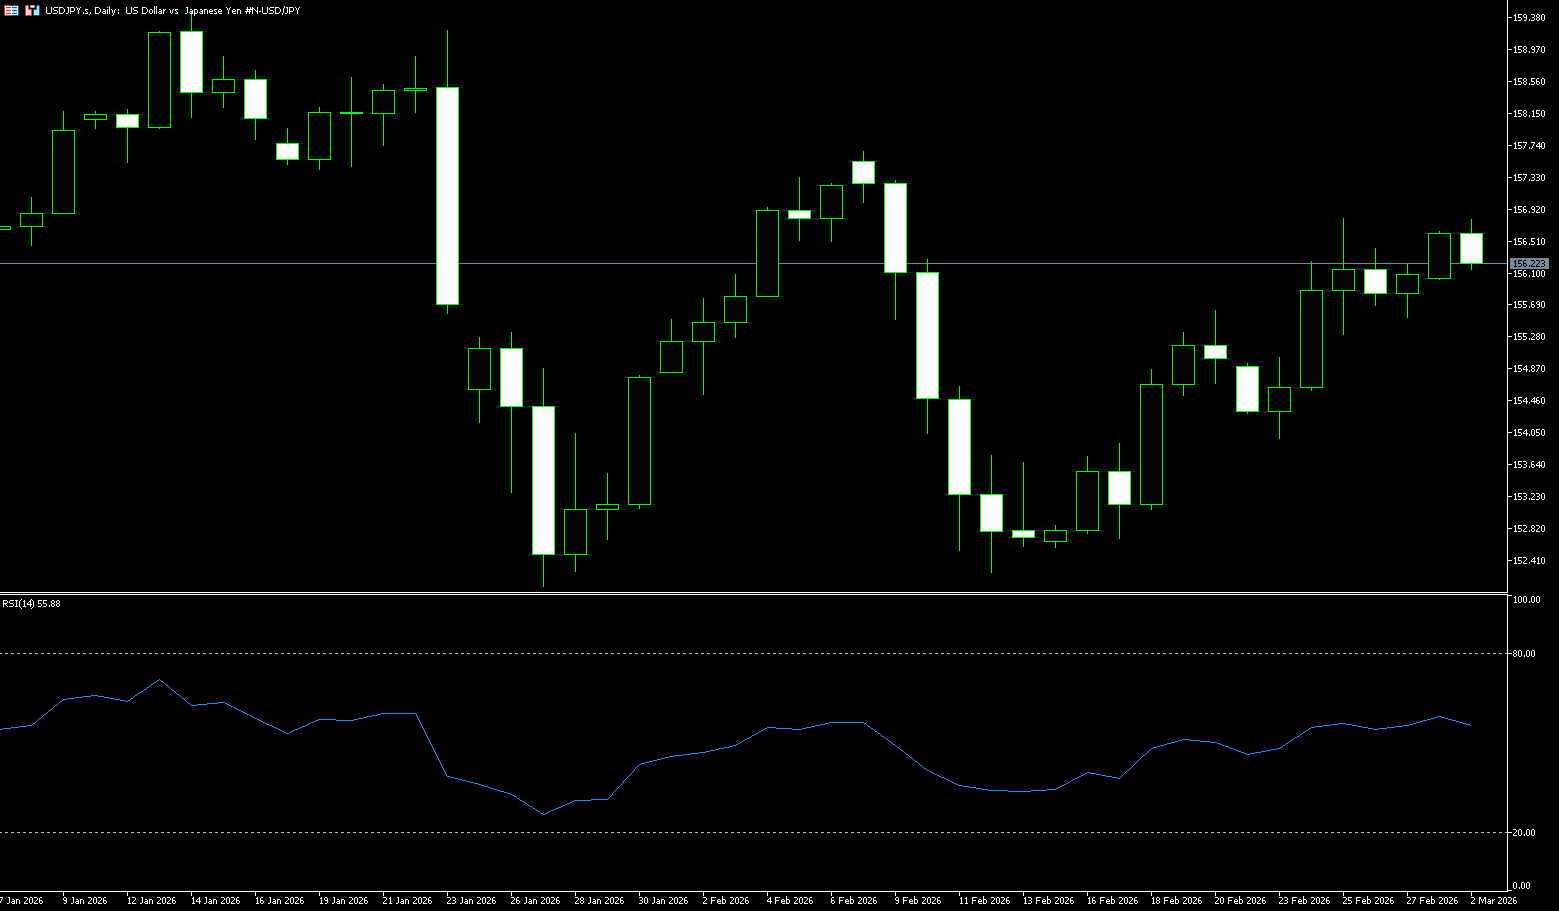
USD/JPY
The USD/JPY exchange rate rose slightly above 156 last week. Before the weekend, the release of the Tokyo Consumer Price Index attracted new sellers; the index showed slightly higher-than-expected growth in February, marking the second consecutive day of this. This, coupled with hawkish comments from Bank of Japan officials, provided moderate support for the yen, supporting the rationale for further policy tightening. In addition, continued safe-haven buying amid trade-related uncertainties and geopolitical tensions further strengthened the yen's safe-haven status. Bank of Japan policy board member Hajime Takada recently signaled a hawkish policy stance, clearly stating that Japanese inflation is "close" to reaching the 2% target, and bluntly stating that the 2% inflation target has been "mission accomplished," and the economic normalcy brought about by the long-term deflationary era has been largely broken. The Bank of Japan's (BOJ) explicit stance that its inflation target is "nearly achieved" sends a hawkish signal, providing key justification for further tightening of policy and continued reduction in bond holdings. This also directly injects potential upward momentum into the yen's exchange rate, outlining a deep correlation between the BOJ's policy normalization and the yen's performance. Hajime Takada supports the BOJ's continued gradual interest rate hike path, advocating for another "tightening" of monetary policy, and revealed that at the January 2026 monetary policy meeting, he has proposed raising the policy rate from 0.75% in December 2025 to 1.0%. From an exchange rate perspective, if the market gradually prices higher terminal interest rates, it will directly narrow the Japan-US interest rate differential, providing substantial upward support for the yen's exchange rate. As the BOJ gradually exits quantitative easing, the central level of Japanese government bond yields is expected to shift further upward, increasing the attractiveness of yen assets.
The USD/JPY pair generally traded in a high-level consolidation pattern last week, with a core range of 154.80–156.80. Short-term bears have the upper hand, but key support levels have not been broken. The USD/JPY chart shows strong upward momentum in late February. Market expectations of a weaker yen pushed the yen down further. The USD/JPY pair bottomed out and rebounded at the beginning of the week, then rose and fell back in the middle, before weakening again on Friday. The daily chart shows a high-level consolidation and decline, forming a small downward channel with gradually lower highs. The week closed lower with a long upper shadow, indicating weakening upward momentum. The daily moving average system shows that the short-term moving averages (5/10 days) have turned downwards, putting pressure on the pair; the medium-term moving averages (20/50 days) are still upwards, but the slope is slowing, indicating a weakening bullish trend. Furthermore, the RSI (14-day) has fallen from above 60 to around 55, indicating a neutral to weak bias; it is not oversold but the downward trend is clear. The MACD shows a high-level death cross and expanding green bars, indicating weakening bullish momentum and short-term bearish dominance. The first support level this week is at 155.00 (the psychological level) and the 155.07 (105-day moving average) area; followed by 154.17 (120-day moving average), a break below which would target 153.98 (last week's low). On the other hand, a strong hold above 156.18 (last week's closing price) and the 156.02 (50-day moving average) area would suggest the yen weakens again to 156.82 (last week's high), and could further challenge 157.66 (February 9th high) and the 158.00 (psychological level).
Today, consider shorting the US dollar around 156.30; Stop loss: 156.50; Target: 155.20; 155.30
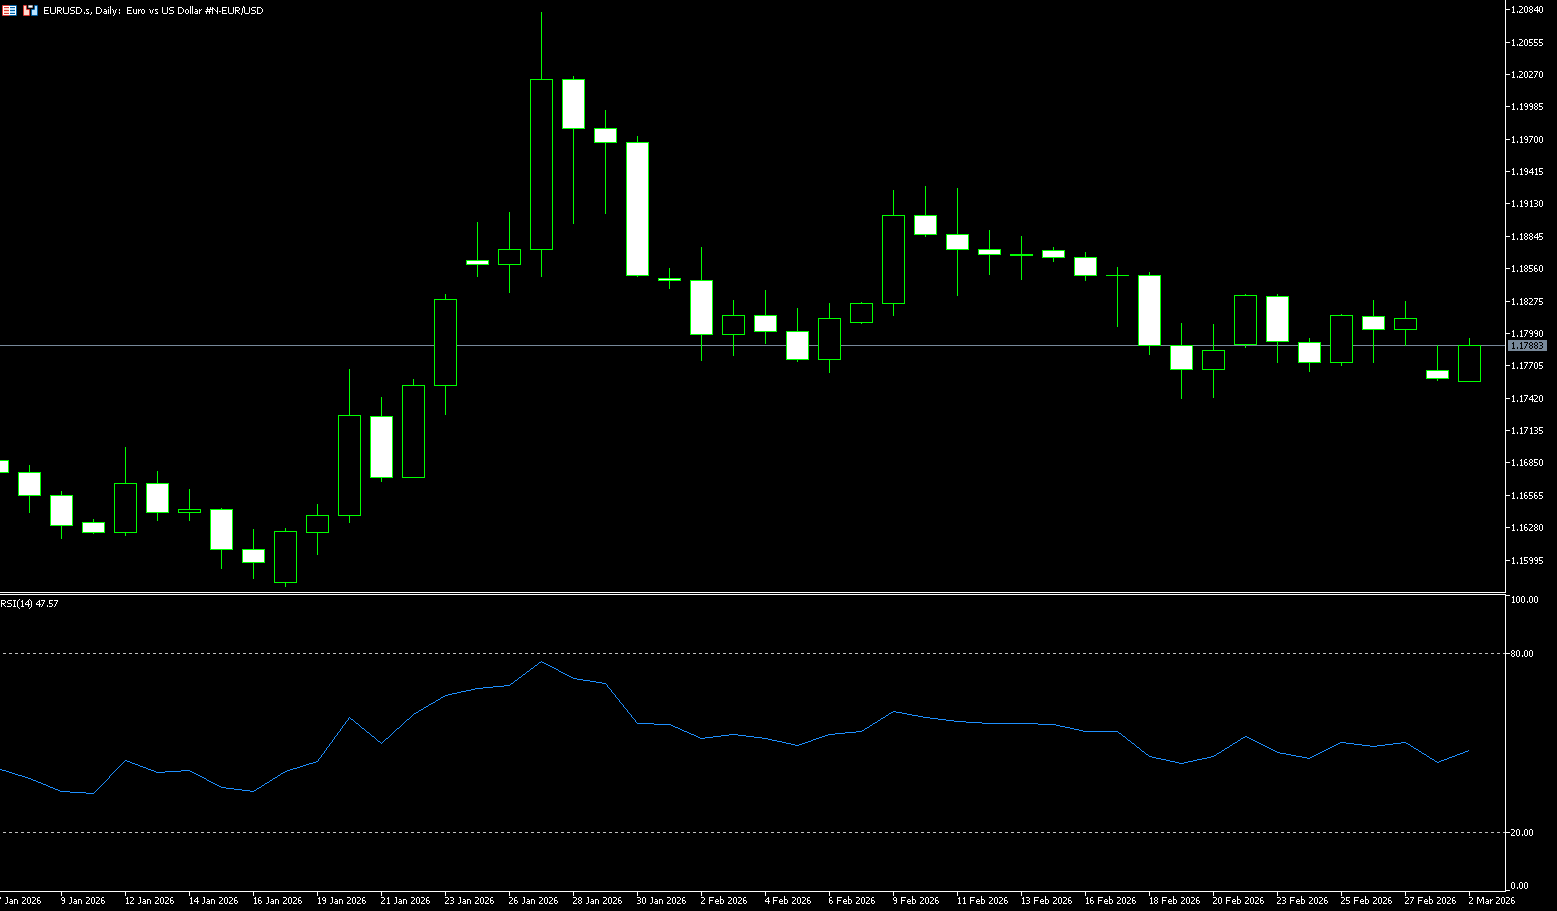
EUR/USD
Last week, the EUR/USD pair rose slightly, climbing back to just above 1.1800. The German Harmonized Index of Consumer Prices (HICP) is expected to rise 0.5% month-on-month after a 0.1% decline in January, with the annual rate steadily increasing to 2.1%. The impact of German inflation data on the Eurozone interest rate outlook is expected to be limited, as ECB President Christine Lagarde stated at the European Parliament's Committee on Economic and Monetary Affairs on Thursday that she is confident that inflation will stabilize at the 2% target in the near term. Regarding the monetary policy outlook, Lagarde stated, "Our interest rate decisions will be based on our assessment of the inflation outlook and the risks associated with it," and, "We (the ECB) will continue to adopt a data-driven and meeting-by-meeting approach to determine the appropriate stance of monetary policy." On the other hand, despite the Federal Reserve maintaining a relatively hawkish stance, renewed market concerns about US trade policy have kept dollar bulls cautious. Meanwhile, amid escalating uncertainty surrounding US tariff policy, the US dollar remained under pressure, and the euro rebounded above 1.18 against the dollar for the second consecutive day. Despite the Federal Reserve maintaining a hawkish stance, the market is more focused on the potential economic impact of trade frictions. At the same time, the European Central Bank signaled policy stabilization, providing support for the euro. Short-term movements will still depend on Lagarde's speech and US employment data.
The rebound is likely to remain limited until the Fed's interest rate path in 2026 becomes clearer, or the Eurozone provides a more convincing upward move. Currently, the dollar remains the priority, followed by the euro. On the daily chart, EUR/USD is trading near the psychological level of 1.1800. The pair is consolidating above the 55-day and 100-day simple moving averages, which cluster in the 1.1780-1.1695 range, while the 200-day simple moving average lags behind around 1.1666, maintaining a slight bullish bias. Price action above these moving averages indicates that buyers are defending the medium-term trend. The 14-day Relative Strength Index (RSI) on the daily chart is near the midline around 51, consistent with the momentum of range-bound trading. The declining Average Directional Index (ADX) below 20 indicates a weakening trend and reinforces the neutral-to-upward stance. Immediate support lies at 1.1742 (February 19 low), which intersects with the nearby 70-day simple moving average (1.1744). A break below this level would expose 1.1700 (psychological level) as the next downside level, followed by 1.1666 (200-day simple moving average) and the 1.1600 level. On the upside, initial resistance is at 1.1834 (last week's high), followed by 1.1884 (February 13 high) and the 1.1900 (psychological level) area. These levels limit the broader range and define the area bulls need to reclaim for a stronger uptrend.
Consider shorting the Euro today around 1.1825; Stop loss: 1.1835; Target: 1.1750, 1.1740
Disclaimer: The information contained herein (1) is proprietary to BCR and/or its content providers; (2) may not be copied or distributed; (3) is not warranted to be accurate, complete or timely; and, (4) does not constitute advice or a recommendation by BCR or its content providers in respect of the investment in financial instruments. Neither BCR or its content providers are responsible for any damages or losses arising from any use of this information. Past performance is no guarantee of future results.


การเปิดเผยความเสี่ยง:ผลิตภัณฑ์เดริวเทรียลนี้ถูกซื้อขายนอกระบบด้วยการมาร์จิ้นซึ่งหมายความว่ามีความเสี่ยงสูงและมีโอกาสที่คุณอาจสูญเสียการลงทุนทั้งหมดได้ ผลิตภัณฑ์เหล่านี้ไม่เหมาะสำหรับนักลงทุนทุกคน โปรดตระหนักถึงความเสี่ยงอย่างเต็มที่และพิจารณาอย่างรอบคอบสถานการณ์การเงินและประสบการณ์การซื้อขายของคุณก่อนที่จะซื้อขาย หากจำเป็นกรุณาสืบค้นคำแนะนำทางการเงินอิสระ
BCR Co Pty Ltd (หมายเลขบริษัท 1975046) เป็นบริษัทที่จัดตั้งขึ้นภายใต้กฎหมายของหมู่เกาะบริติชเวอร์จิน โดยมีสำนักงานจดทะเบียนที่ Trident Chambers, Wickham’s Cay 1, Road Town, Tortola, British Virgin Islands และได้รับใบอนุญาตและอยู่ภายใต้การกำกับดูแลของ British Virgin Islands Financial Services Commission ภายใต้ใบอนุญาตเลขที่ SIBA/L/19/1122.
Open Bridge Limited (หมายเลขบริษัท 16701394) เป็นบริษัทที่จัดตั้งขึ้นภายใต้กฎหมาย Companies Act 2006 และจดทะเบียนในประเทศอังกฤษและเวลส์ ที่อยู่ที่จดทะเบียนคือ Kemp House, 160 City Road, London, City Road, London, England, EC1V 2NX. องค์กรนี้ทำหน้าที่เป็นผู้ประมวลผลการชำระเงินเท่านั้น และไม่ให้บริการด้านการซื้อขายหรือการลงทุนใด ๆ.

 English
 简体中文
简体中文
 繁體中文
繁體中文
 Bahasa
Melayu
Bahasa
Melayu
 Tiếng
Việt
Tiếng
Việt
 ไทย
ไทย
 日本語
日本語
 한국어
한국어
 ភាសាខ្មែរ
 español