


0
U.S. Dollar Index (DXY)
The U.S. Dollar Index fell last week to 98.98, nearing a five-week low, as traders focused on this week’s Federal Reserve policy decision and broadly expect a rate cut. Weaker labor market data has further reinforced expectations for easing, although the market-priced 90% probability may still be overstated. Major institutions, including Morgan Stanley, have revised their forecasts and now expect a 25-basis-point rate cut in December, reversing their previous outlook for unchanged rates.
Markets also believe the dollar remains overvalued against major currencies, making the current pullback fundamentally justified. Data released last Friday showed a slight improvement in U.S. consumer sentiment in early December, but it provided only limited support to the dollar. Investors are also watching speculation that White House economic adviser Kevin Hassett could succeed Fed Chair Powell, potentially signaling a more dovish policy path. Expectations of a near-term rate cut and a potentially more accommodative Fed continue to weigh on the dollar.
For both U.S. Treasuries and the dollar, the key issue now lies in how the Fed frames this policy move. The transmission from yields to the dollar has moved beyond the simple “rate cuts equal dollar weakness” logic. The Dollar Index is currently hovering near the 99.00 level and trading below the 50-day SMA at 99.17, with key support at 98.60 (100-day SMA). If the Fed clearly signals the start of a full easing cycle, the index may test and break 98.77 (five-week low) and the 98.60 region.
A key risk is that if the Bank of Japan raises rates in December, this would create a sharp policy divergence with the Fed. Such a mismatch in monetary cycles could trigger cross-market capital reallocation and intensify downside pressure on the dollar toward the 98.00 level. If the Fed delivers a more hawkish message, a short-term rebound toward the 200-day SMA at 99.44 and 99.71 (Nov 27 high) is possible—but the medium-term downtrend would remain difficult to reverse.

WTI Crude Oil (Spot)
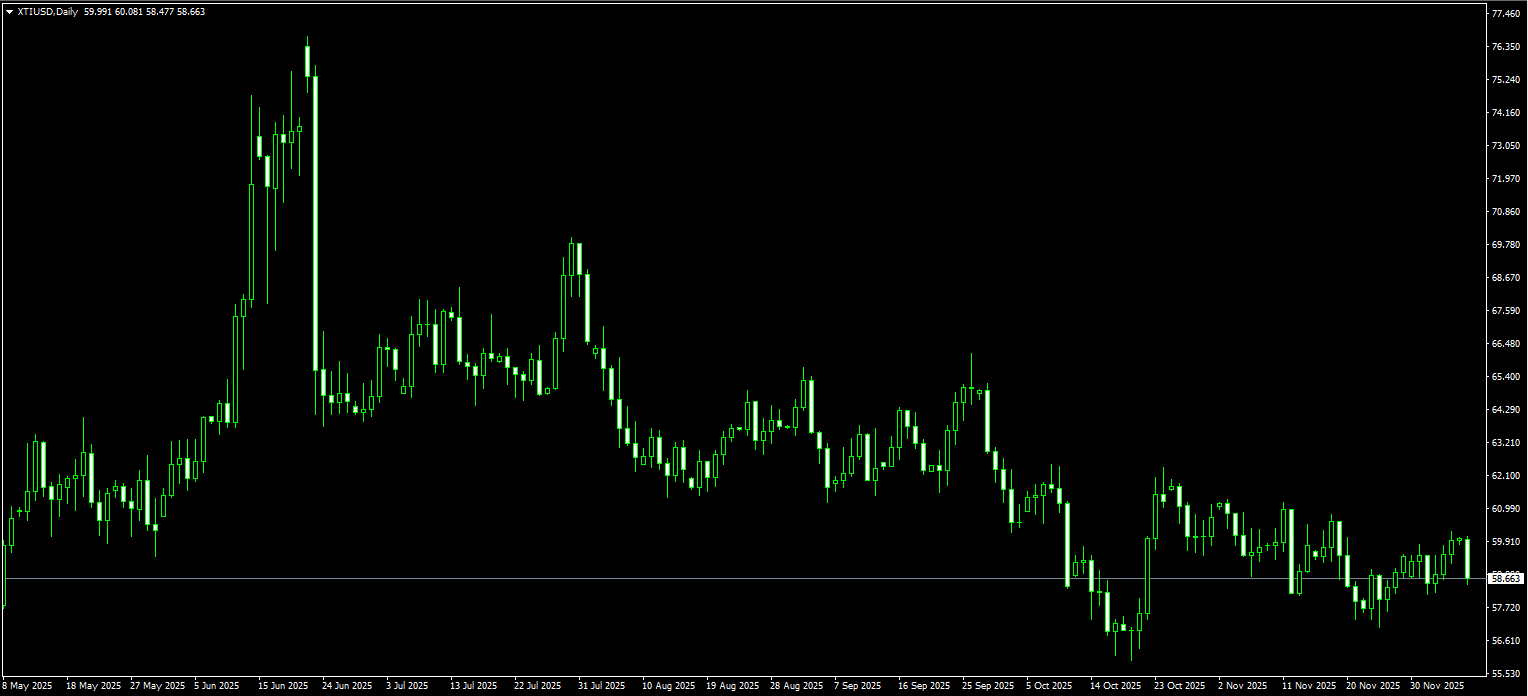
U.S. crude is trading just below $59 per barrel, supported by demand expectations and heightened geopolitical uncertainty. Earlier comments from Donald Trump Jr. suggested that ongoing corruption allegations against allies of Ukrainian President Zelensky could prompt the U.S. to reconsider its role in Ukraine peace efforts. Investors have also digested U.S. inflation data and re-priced expectations for Federal Reserve rate cuts.
Markets continue to monitor developments in Russia and Venezuela, two sanctioned OPEC+ producers, to assess whether future supply will rise or fall. The latest round of Ukraine peace talks in Moscow failed to achieve major progress, adding upward pressure to oil prices. While stalled peace negotiations are bullish, OPEC’s resilient output levels remain a bearish counterforce—leaving the market in a relatively balanced state.
There is also rising speculation about possible U.S. military action against Venezuela, after Trump reiterated that ground operations could begin “soon” to combat drug trafficking. Such a move could threaten Venezuela’s 1.1 million barrels per day of crude output.
From a technical perspective, the rebound trend has strengthened. If the Fed continues easing, oil prices still have upside potential. The main uncertainty lies in whether global demand can recover as expected and whether geopolitical tensions could ease suddenly, increasing supply pressure.
On the daily chart, WTI is transitioning from weak consolidation into a stronger rebound structure. Prices have formed a solid base near $58.17 (last week’s low) and the $58 psychological level, followed by a steady recovery and a breakout above short-term moving averages—signaling strengthening bullish momentum. The $60 level is now the key short-term resistance. A convincing break above it would open the path toward $62 and higher.
The MACD histogram continues to contract toward the zero line, showing significantly weakening bearish momentum and increasing upside breakout potential. On the downside, the $58.00–$58.17 zone is the critical defense area. A break below could reopen downside risk toward $57.10.
Spot Gold
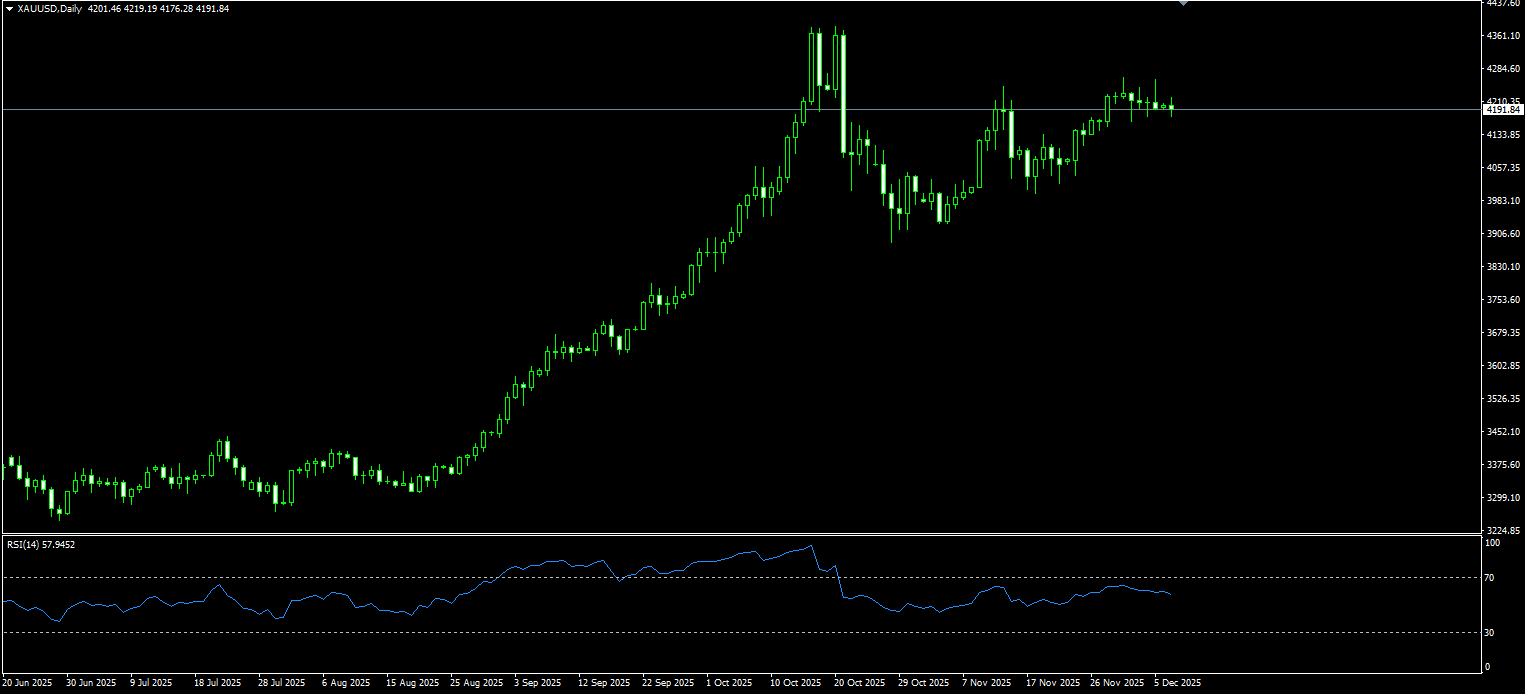
On Monday, spot gold hovered around $4,190 per ounce as markets await this week’s Federal Reserve rate decision. The probability of a 25-bp rate cut currently stands at 86.2%, while geopolitical uncertainty continues to underpin gold prices. Growing confidence in monetary easing has kept the dollar slightly weaker, which is supportive for gold.
Geopolitical risk also remains elevated. Although the U.S. State Department described recent U.S.–Ukraine “peace plan” discussions as constructive, Ukraine’s National Security Council Secretary Umerov reiterated that Ukraine’s core priority is securing an outcome that preserves its independence and sovereignty. Both sides acknowledged that real progress depends on Russia’s willingness to commit to lasting peace. U.S.–Ukraine representatives are scheduled to meet again on the 6th to continue consultations. Tensions in Venezuela are also providing support to gold.
From the daily chart, gold’s broader uptrend remains intact. Price action from last week suggests consolidation between $4,178 (12-day SMA) and $4,264.50 (last week’s high) while markets await the Fed decision. Upside momentum has softened slightly, as reflected by the 14-day RSI hovering near 60—still bullish but flattening.
A break above $4,264 would pave the way toward $4,300 (psychological level) and the record high at $4,381. Conversely, a drop below $4,178 would expose initial support at $4,151 (Nov 28 low) and $4,149 (20-day SMA), followed by the $4,100 psychological level.
AUD/USD
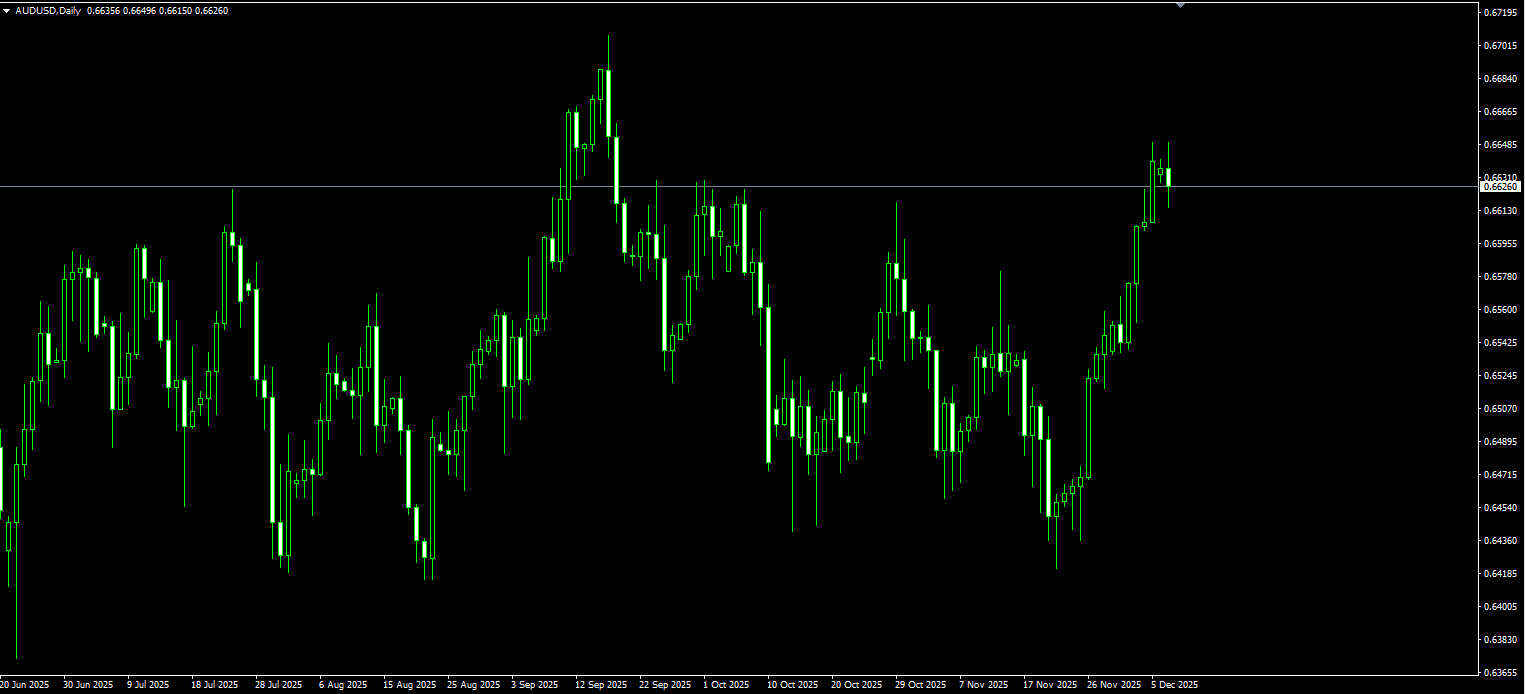
The Australian dollar is trading near 0.6630, holding at a two-month high as stronger-than-expected domestic demand boosts expectations that the RBA could resume rate hikes. Q3 GDP showed solid growth momentum, and with rising inflation, household spending—over half of total economic output—surged 1.3% in October, far exceeding the 0.6% forecast and marking the biggest gain since January 2024. This strengthens the case for possible rate hikes next year.
Markets now see a 50% probability of a rate hike in May, reflecting growing upside policy bets. RBA Governor Michele Bullock noted that inflation pressures may ease somewhat, but warned the economy is approaching capacity limits—prompting expectations that the upcoming policy statement may strike a hawkish tone. Attention now turns to tomorrow’s RBA meeting, where rates are expected to remain at 3.60% after three cuts this year.
On the daily chart, the 14-day RSI sits near 68, close to overbought territory but still reflecting strong bullish momentum. The ADX has climbed to 19, showing that trend strength is recovering after a period of weakness. If upcoming data surprises to the upside, AUD could strengthen further, with initial resistance at 0.6700. A decisive close above this level would open the door to the yearly high at 0.6707 (Sept 17).
On the downside, support lies near 0.6600 and 0.6598 (Dec 4 low). Further declines could extend toward 0.6567 (10-day EMA).
GBP/USD
GBP/USD started the new week on a subdued note, consolidating in a narrow 1.3325–1.3335 range during Asian trading. However, spot prices remain near their highest level since October 22, reached last Thursday. Bulls are waiting for sustained strength and confirmation above the 50-day SMA at 1.3264 before adding new positions.
The dollar continues to hover near multi-month lows amid expectations that the Fed will cut rates this week—providing ongoing support for GBP/USD. However, traders remain reluctant to place aggressive directional bets ahead of clearer guidance on the Fed’s future easing path. Focus will therefore turn to the updated economic projections and Fed Chair Jerome Powell’s press-conference remarks.
Last week, GBP/USD broke above the 1.3275–1.3280 confluence zone, the 200-day SMA at 1.3332, and the 38.2% Fibonacci retracement of the September–November decline—key bullish triggers. With daily oscillators holding in positive territory, further buying above 1.3365 (50% retracement) could lift prices back toward the 1.3400 zone. Momentum could then extend toward 1.3455–1.3460 (61.8% retracement) and eventually the 1.3500 psychological level.
On the downside, strong support is expected near 1.3300, followed by 1.3264 (50-day SMA) and then the 1.3200 level.

USD/JPY
Tensions in Japan escalated after a 7.6-magnitude earthquake struck the country’s northeast. According to Nikkei Asia, tsunami warnings were issued for Hokkaido, Aomori, and Iwate. The disaster immediately pressured Japanese assets, while the yen weakened as investors assessed potential economic fallout and the risk that the Bank of Japan may delay its expected rate hike.
Meanwhile, data showed real wages fell for the tenth consecutive month in October, and Q3 economic contraction was deeper than initially reported—complicating the outlook for interest rates. Externally, broad dollar weakness on expectations of a Fed rate cut this week continues to support the yen.
Because the yen has long served as a stable, low-yield global funding currency, any yen appreciation forces investors to unwind carry trades by selling USD—further reinforcing yen strength. Following this pullback, the yen may begin another appreciation cycle.
USD/JPY rebounded after touching the midline of its upward channel. Short-term support is located at 145.42 (5-day SMA), followed by 145.27 (30-day SMA), and then last Friday’s low around 154.35, below which prices may drop toward the 154.00 psychological level. A break below these supports would indicate the end of the pullback and a resumption of yen strength.
Resistance is seen at 156.74 (Nov 26 high) and 157.00, where renewed yen appreciation could resume.

EUR/USD
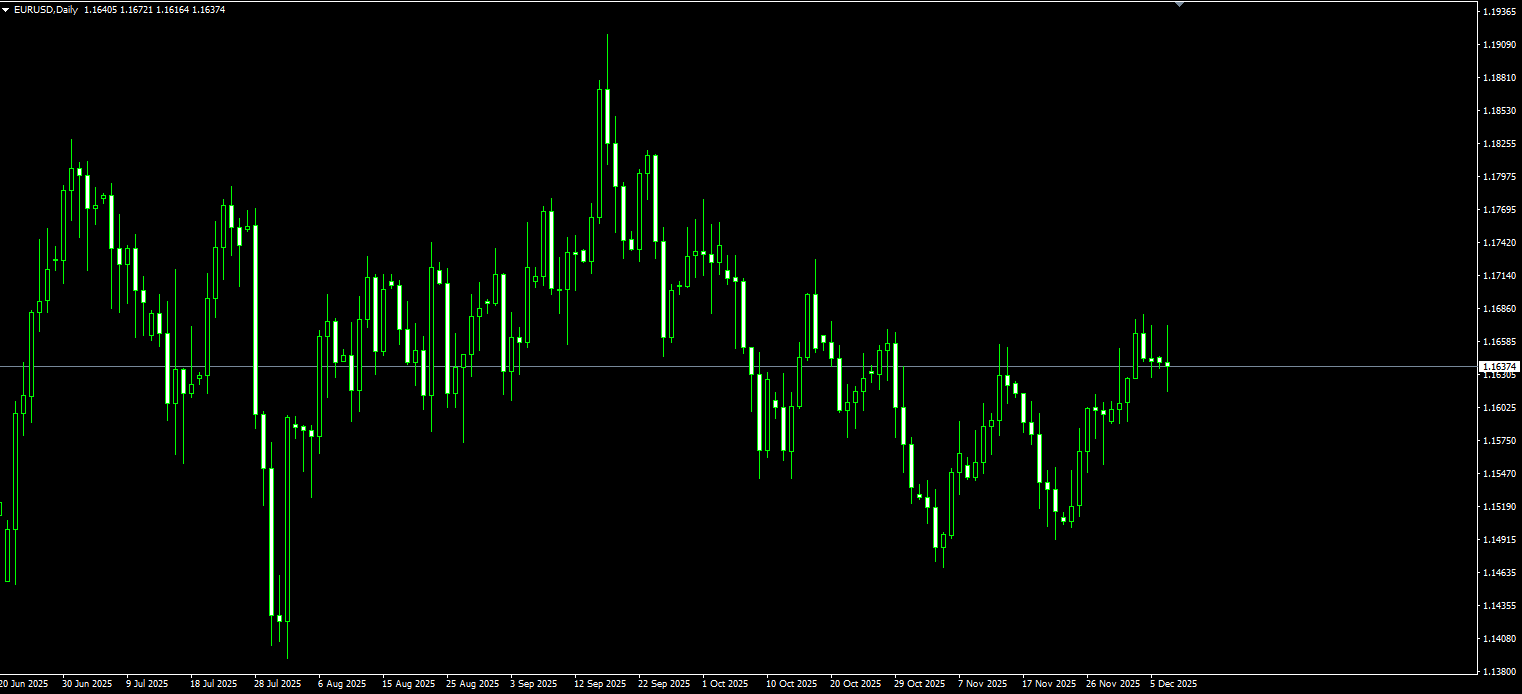
During early Asian trading on Monday, EUR/USD edged higher near 1.1645. Expectations of a 25-bp Fed rate cut this Wednesday continue to weigh on the dollar and support the euro. Markets currently price the probability of a cut at nearly 87%, which would bring the federal funds target range to 3.50%–3.75%. Traders will closely monitor the Fed’s press conference and dot plot for fresh market direction. A “hawkish cut” could support the dollar and cap gains in major currency pairs.
Across the Atlantic, Eurozone November inflation came in slightly above expectations, easing the immediate pressure on the ECB to cut rates. Economists now expect the ECB to hold rates steady at the December 18 meeting. Rising confidence that the ECB’s easing cycle may be ending could provide short-term support for the euro.
From a technical perspective, the 10-day SMA at 1.1620 has crossed above the 50-day SMA at 1.1608, forming a bullish “golden cross.” The pair remains supported above 1.1620, while the 14-day RSI at 61 maintains a neutral-to-bullish bias.
Measured from the 1.1918 high to the 1.1473 low, the 50% Fibonacci retracement at 1.1695, along with 1.1700, acts as key resistance. A breakout above this zone would expose the October 17 high at 1.1728, followed by the next upside target at 1.1778 (Oct 1 high).
On the downside, strong support lies at 1.1609 (50-day SMA) and 1.1600, followed by 1.1555 (Nov 28 low).
* Disclaimer: This content does not constitute investment advice. CFDs are complex instruments and come with a high risk of losing money rapidly due to leverage. You should consider whether you understand how CFDs work and whether you can afford to take the high risk of losing your money.
More Coverage


Risk Disclosure:Derivatives are traded over-the-counter on margin, which means they carry a high level of risk and there is a possibility you could lose all of your investment. These products are not suitable for all investors. Please ensure you fully understand the risks and carefully consider your financial situation and trading experience before trading. Seek independent financial advice if necessary before opening an account with BCR.
BCR Co Pty Ltd (Company No. 1975046) is a company incorporated under the laws of the British Virgin Islands, with its registered office at Trident Chambers, Wickham’s Cay 1, Road Town, Tortola, British Virgin Islands, and is licensed and regulated by the British Virgin Islands Financial Services Commission under License No. SIBA/L/19/1122.
Open Bridge Limited (Company No. 16701394) is a company incorporated under the Companies Act 2006 and registered in England and Wales, with its registered address at Kemp House, 160 City Road, London, City Road, London, England, EC1V 2NX. This entity acts solely as a payment processor and does not provide any trading or investment services.

 English
 简体中文
简体中文
 繁體中文
繁體中文
 Bahasa
Melayu
Bahasa
Melayu
 Tiếng
Việt
Tiếng
Việt
 ไทย
ไทย
 日本語
日本語
 한국어
한국어
 ភាសាខ្មែរ
 español